Silvereye
Zosterops lateralis
ABR description
The following is extracted from the Annual Bird Report for the twelve months to June 2017.
Common, breeding resident/migrant
A common sight in Canberra parks, gardens, and the surrounding woodlands.
General: Number of birds (13,090) like last year (13,597) though far higher than the 10YA (4,243) and the 30YA (2,017). Recorded in every week, with a lower proportion in winter (14%) than in spring (27%), summer (32%) and autumn (27%). Reporting rate (17%) similar to last year, the 10YA and the 30YA (all 18%). Records from 42% of grid cells surveyed, similar to last year (41%), the 10YA (38%) and 30YA (36%). Max 80 (94 last year), mean 5.5, median 3. 6 breeding records (7 last year): first dy/27 Oct Turner GrK13 (BoC4) and last dy/23 Feb Weston Park GrK14 (ClJ3).
GBS: Number of birds (7,001) slightly lower than last year (8,254) and fewer than the 10YA (11,491) and the 30YA (13425). Recorded in all weeks, with a lower proportion in winter (20%) than in spring (24%), summer (29%) and autumn (29%). Reporting rate (41%) similar to last year (39%) though lower than the 10YA (50%) and the 30YA (60%). Records from 78% of sites, similar to last year (82%), but a little below the 10YA (91%) and the 30YA (95%). 7th most abundant species. Abundance similar to last year but lower than the 10YA (3.5895) and the 30YA (4.9341). 17 breeding records (and 17 last year) from 8 sites: first cf/6 Nov Jerrabomberra GrM16 (HaL2) and last cf/23 Apr Red Hill GrK14 (WaR4).

Abundance
Abundance is the average number of birds of that species per survey. Where the species was observed (presence recorded) but the number of birds seen was not recorded, this is treated as a count of zero.
Abundance by year
This chart shows the abundance of Silvereye between 1982 and 2017. 
Abundance by month
This chart shows the monthly abundance of Silvereye. The blue lines show the abundance for the twelve months to June 2017 and the bars show the average abundance for the period 1982 to 2017. 
Abundance by season
This chart shows the seasonal abundance of Silvereye. The blue lines show the seasonal abundance for the twelve months to June 2017 and the bars show the average seasonal abundance for the period 1982 to 2017. 
Abundance data
| Month | Season | ||||||||||||||||||
|---|---|---|---|---|---|---|---|---|---|---|---|---|---|---|---|---|---|---|---|
| Period | Jul | Aug | Sep | Oct | Nov | Dec | Jan | Feb | Mar | Apr | May | Jun | Winter | Spring | Summer | Autumn | All | ||
| All years | |||||||||||||||||||
| All | 0.7 | 0.8 | 0.6 | 0.8 | 0.4 | 0.4 | 0.8 | 1.0 | 1.0 | 1.5 | 0.8 | 0.4 | 0.6 | 0.6 | 0.7 | 1.1 | 0.8 | ||
| Previous years | |||||||||||||||||||
| All previous years | 0.7 | 0.7 | 0.6 | 0.8 | 0.4 | 0.4 | 0.7 | 1.0 | 1.0 | 1.5 | 0.8 | 0.4 | 0.6 | 0.6 | 0.7 | 1.1 | 0.8 | ||
| Previous 30 years | 0.7 | 0.7 | 0.6 | 0.8 | 0.4 | 0.3 | 0.7 | 1.0 | 1.0 | 1.4 | 0.8 | 0.4 | 0.6 | 0.6 | 0.6 | 1.1 | 0.7 | ||
| Previous 20 years | 0.8 | 0.8 | 0.6 | 0.8 | 0.4 | 0.3 | 0.7 | 1.0 | 1.0 | 1.5 | 0.9 | 0.5 | 0.7 | 0.6 | 0.7 | 1.1 | 0.8 | ||
| 10 year groups | |||||||||||||||||||
| [2007,2017) | 1.0 | 1.0 | 0.8 | 0.9 | 0.4 | 0.4 | 0.8 | 1.1 | 1.2 | 1.6 | 1.0 | 0.6 | 0.8 | 0.7 | 0.7 | 1.3 | 0.9 | ||
| [1997,2007) | 0.3 | 0.5 | 0.3 | 0.5 | 0.3 | 0.2 | 0.5 | 0.8 | 0.6 | 1.2 | 0.5 | 0.2 | 0.3 | 0.4 | 0.5 | 0.8 | 0.5 | ||
| [1987,1997) | 0.5 | 0.3 | 0.4 | 0.7 | 0.3 | 0.4 | 0.6 | 0.6 | 0.9 | 1.3 | 0.5 | 0.4 | 0.4 | 0.5 | 0.6 | 0.9 | 0.6 | ||
| 5 year groups | |||||||||||||||||||
| [2012,2017) | 1.2 | 1.2 | 0.9 | 0.9 | 0.5 | 0.5 | 0.8 | 1.2 | 1.4 | 1.9 | 1.1 | 0.6 | 1.0 | 0.8 | 0.8 | 1.5 | 1.0 | ||
| [2007,2012) | 0.7 | 0.4 | 0.4 | 0.8 | 0.3 | 0.2 | 0.6 | 1.0 | 0.7 | 0.9 | 0.7 | 0.5 | 0.5 | 0.6 | 0.5 | 0.8 | 0.6 | ||
| [2002,2007) | 0.4 | 0.5 | 0.3 | 0.5 | 0.3 | 0.2 | 0.4 | 0.8 | 0.5 | 0.9 | 0.6 | 0.2 | 0.3 | 0.4 | 0.4 | 0.7 | 0.4 | ||
| [1997,2002) | 0.3 | 0.4 | 0.4 | 0.5 | 0.3 | 0.3 | 0.5 | 0.8 | 0.8 | 1.5 | 0.4 | 0.2 | 0.3 | 0.4 | 0.5 | 0.9 | 0.5 | ||
| [1992,1997) | 0.8 | 0.4 | 0.3 | 1.0 | 0.3 | 0.5 | 0.9 | 0.7 | 1.4 | 2.1 | 0.9 | 0.4 | 0.5 | 0.6 | 0.7 | 1.5 | 0.8 | ||
| [1987,1992) | 0.3 | 0.2 | 0.4 | 0.5 | 0.3 | 0.4 | 0.5 | 0.6 | 0.6 | 0.9 | 0.3 | 0.4 | 0.3 | 0.4 | 0.5 | 0.6 | 0.5 | ||
| Year | |||||||||||||||||||
| 2017 | 1.0 | 1.4 | 0.7 | 1.1 | 0.7 | 0.5 | 1.0 | 1.1 | 1.0 | 1.7 | 0.7 | 0.4 | 0.8 | 0.8 | 0.9 | 1.1 | 0.9 | ||
| 2016 | 1.3 | 1.3 | 1.2 | 1.1 | 0.7 | 0.6 | 1.3 | 1.3 | 1.7 | 1.5 | 0.8 | 0.7 | 1.1 | 1.0 | 1.1 | 1.4 | 1.2 | ||
| 2015 | 0.7 | 1.4 | 1.3 | 0.9 | 0.6 | 0.7 | 0.6 | 1.5 | 1.3 | 2.4 | 1.6 | 0.7 | 0.9 | 0.9 | 0.9 | 1.8 | 1.1 | ||
| 2014 | 2.3 | 1.8 | 0.7 | 0.8 | 0.6 | 0.6 | 0.7 | 0.8 | 1.9 | 3.2 | 1.3 | 0.6 | 1.4 | 0.7 | 0.7 | 2.2 | 1.2 | ||
| 2013 | 1.4 | 0.5 | 0.3 | 1.1 | 0.3 | 0.2 | 0.7 | 0.8 | 0.8 | 1.2 | 0.8 | 0.2 | 0.7 | 0.6 | 0.5 | 0.9 | 0.7 | ||
| 2012 | 0.5 | 0.4 | 0.5 | 0.6 | 0.2 | 0.2 | 0.4 | 0.3 | 0.6 | 1.2 | 0.8 | 0.5 | 0.5 | 0.5 | 0.3 | 0.9 | 0.5 | ||
| 2011 | 1.7 | 0.4 | 0.5 | 0.7 | 0.3 | 0.2 | 0.6 | 0.4 | 1.2 | 2.1 | 0.4 | 0.8 | 0.9 | 0.6 | 0.4 | 1.3 | 0.8 | ||
| 2010 | 0.6 | 0.3 | 0.3 | 0.7 | 0.2 | 0.1 | 0.4 | 1.0 | 0.6 | 0.5 | 0.8 | 0.3 | 0.3 | 0.5 | 0.3 | 0.6 | 0.4 | ||
| 2009 | 0.5 | 0.9 | 0.6 | 0.6 | 0.4 | 0.1 | 0.7 | 1.8 | 0.6 | 0.3 | 0.4 | 0.1 | 0.4 | 0.6 | 0.7 | 0.4 | 0.5 | ||
| 2008 | 0.4 | 0.3 | 0.4 | 1.0 | 0.3 | 0.2 | 1.0 | 1.3 | 0.5 | 0.8 | 1.4 | 0.5 | 0.4 | 0.8 | 0.7 | 0.9 | 0.7 | ||
| 2007 | 0.2 | 0.3 | 0.1 | 0.8 | 0.2 | 0.2 | 0.6 | 1.0 | 0.6 | 0.5 | 1.1 | 0.5 | 0.4 | 0.5 | 0.5 | 0.7 | 0.5 | ||
| 2006 | 0.2 | 0.3 | 0.3 | 0.8 | 0.2 | 0.1 | 0.8 | 0.6 | 0.7 | 1.1 | 0.9 | 0.3 | 0.3 | 0.5 | 0.5 | 0.9 | 0.5 | ||
| 2005 | 0.6 | 0.4 | 0.1 | 0.2 | 0.4 | 0.2 | 0.6 | 0.9 | 0.4 | 1.6 | 0.6 | 0.2 | 0.4 | 0.2 | 0.5 | 0.8 | 0.5 | ||
| 2004 | 0.3 | 0.4 | 0.3 | 0.9 | 0.4 | 0.1 | 0.4 | 1.2 | 0.4 | 0.6 | 0.8 | 0.1 | 0.2 | 0.5 | 0.4 | 0.6 | 0.4 | ||
| 2003 | 0.2 | 0.6 | 0.4 | 0.4 | 0.2 | 0.3 | 0.1 | 1.0 | 0.6 | 0.6 | 0.1 | 0.1 | 0.3 | 0.3 | 0.5 | 0.5 | 0.4 | ||
| 2002 | 0.6 | 0.9 | 0.5 | 0.2 | 0.4 | 0.2 | 0.2 | 0.5 | 0.2 | 0.6 | 0.8 | 0.2 | 0.5 | 0.4 | 0.3 | 0.4 | 0.4 | ||
| 2001 | 0.2 | 0.6 | 0.4 | 0.5 | 0.3 | 0.3 | 0.6 | 1.1 | 0.9 | 2.6 | 0.6 | 0.1 | 0.3 | 0.4 | 0.6 | 1.3 | 0.7 | ||
| 2000 | 0.7 | 0.5 | 0.3 | 0.4 | 0.5 | 0.2 | 0.5 | 0.5 | 0.8 | 1.4 | 0.2 | 0.5 | 0.5 | 0.4 | 0.4 | 0.9 | 0.5 | ||
| 1999 | 0.1 | 0.4 | 0.4 | 0.3 | 0.2 | 0.3 | 0.7 | 0.7 | 0.7 | 1.1 | 0.4 | 0.3 | 0.3 | 0.3 | 0.5 | 0.8 | 0.5 | ||
| 1998 | 0.0 | 0.0 | 0.3 | 0.7 | 0.1 | 0.1 | 0.5 | 0.7 | 0.3 | 0.2 | 0.0 | 0.0 | 0.0 | 0.4 | 0.4 | 0.2 | 0.3 | ||
| 1997 | 0.1 | 0.1 | 0.5 | 0.8 | 0.1 | 0.2 | 0.5 | 0.8 | 1.4 | 0.8 | 0.3 | 0.1 | 0.1 | 0.4 | 0.4 | 0.8 | 0.4 | ||
| 1996 | 0.2 | 0.2 | 0.6 | 0.9 | 0.1 | 0.2 | 0.4 | 0.2 | 0.3 | 0.9 | 0.6 | 0.1 | 0.2 | 0.5 | 0.3 | 0.6 | 0.4 | ||
| 1995 | 1.4 | 0.3 | 0.1 | 0.7 | 0.3 | 0.4 | 0.8 | 0.1 | 0.8 | 0.7 | 0.6 | 0.2 | 0.6 | 0.4 | 0.5 | 0.7 | 0.6 | ||
| 1994 | 0.6 | 0.8 | 0.2 | 0.7 | 0.3 | 1.4 | 1.9 | 1.9 | 3.7 | 1.4 | 0.6 | 0.6 | 0.7 | 0.4 | 1.8 | 1.9 | 1.2 | ||
| 1993 | 0.9 | 0.6 | 0.1 | 1.5 | 0.6 | 0.5 | 1.2 | 1.6 | 0.7 | 3.4 | 1.0 | 0.7 | 0.7 | 0.8 | 1.1 | 1.5 | 1.0 | ||
| 1992 | 0.7 | 0.4 | 0.3 | 1.3 | 0.7 | 0.5 | 0.5 | 0.5 | 2.2 | 6.4 | 1.7 | 0.5 | 0.5 | 0.8 | 0.5 | 3.2 | 1.3 | ||
| 1991 | 0.9 | 0.6 | 1.1 | 0.7 | 0.4 | 0.4 | 1.3 | 1.9 | 1.2 | 1.6 | 0.5 | 0.8 | 0.8 | 0.7 | 1.1 | 1.1 | 0.9 | ||
| 1990 | 0.2 | 0.2 | 0.2 | 0.2 | 0.3 | 0.2 | 0.6 | 0.4 | 1.0 | 2.7 | 0.5 | 0.5 | 0.2 | 0.2 | 0.4 | 1.4 | 0.5 | ||
| 1989 | 0.2 | 0.2 | 0.4 | 0.4 | 0.3 | 0.4 | 0.4 | 0.6 | 0.5 | 0.6 | 0.3 | 0.4 | 0.3 | 0.4 | 0.5 | 0.5 | 0.4 | ||
| 1988 | 0.2 | 0.2 | 0.4 | 0.5 | 0.3 | 0.4 | 0.4 | 0.5 | 0.5 | 0.5 | 0.3 | 0.3 | 0.2 | 0.4 | 0.4 | 0.4 | 0.4 | ||
| 1987 | 0.1 | 0.2 | 0.4 | 0.5 | 0.4 | 0.5 | 0.4 | 0.5 | 0.4 | 0.5 | 0.3 | 0.3 | 0.3 | 0.4 | 0.4 | 0.4 | 0.4 | ||
| 1986 | 0.1 | 1.1 | 0.9 | 2.2 | 2.5 | 2.1 | 2.6 | 4.4 | 7.8 | 6.8 | 1.9 | 0.4 | 0.6 | 1.8 | 3.2 | 5.8 | 2.8 | ||
| 1985 | 0.6 | 0.6 | 1.2 | 1.7 | 0.8 | 1.5 | 0.1 | 1.8 | 0.9 | 1.1 | 0.1 | 0.0 | 0.4 | 1.3 | 1.4 | 0.8 | 1.1 | ||
| 1984 | 0.0 | 0.0 | 0.0 | 0.0 | 0.0 | 0.0 | 1.9 | 1.2 | 3.9 | 1.3 | 2.0 | 0.3 | 0.2 | 0.0 | 1.3 | 2.3 | 1.3 | ||
| 1983 | 0.0 | 0.0 | 0.0 | 0.1 | 0.3 | 0.2 | 0.0 | 0.0 | 0.0 | - | 0.0 | 0.0 | 0.0 | 0.1 | 0.1 | 0.0 | 0.1 | ||
| 1982 | - | 0.0 | - | 0.0 | 0.0 | 0.0 | - | 0.0 | - | 0.0 | - | 0.0 | 0.0 | 0.0 | 0.0 | 0.0 | 0.0 | ||
Reporting rates
Reporting rate is the proportion of all surveys in which the species was present.
Reporting rate by year
This chart shows the reporting rate of Silvereye each year between 1982 and 2017. 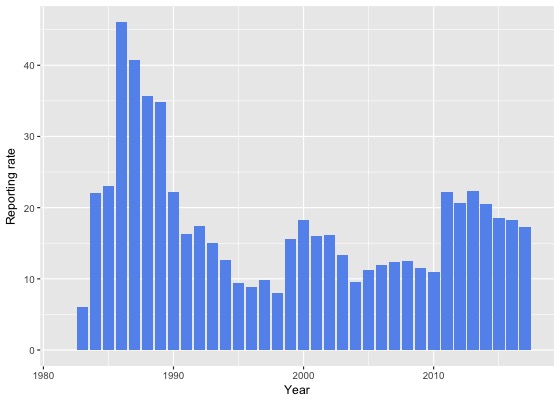
Reporting rate by month
This chart shows the reporting rate by month of Silvereye. The blue lines show the reporting rate for the twelve months to June 2017 and the bars show the average reporting rate for the period 1982 to 2017. 
Reporting rate by season
This chart shows the seasonal reporting rate of Silvereye. The blue lines show the seasonal reporting rate for the twelve months to June 2017 and the bars show the average seasonal reporting rate for the period 1982 to 2017. 
Reporting rate data
| Month | Season | ||||||||||||||||||
|---|---|---|---|---|---|---|---|---|---|---|---|---|---|---|---|---|---|---|---|
| Period | Jul | Aug | Sep | Oct | Nov | Dec | Jan | Feb | Mar | Apr | May | Jun | Winter | Spring | Summer | Autumn | All | ||
| All years | |||||||||||||||||||
| All | 11.7 | 14.5 | 16.3 | 21.0 | 19.0 | 17.5 | 23.7 | 23.1 | 19.6 | 22.5 | 16.9 | 9.4 | 11.6 | 19.0 | 21.4 | 19.9 | 18.3 | ||
| Previous years | |||||||||||||||||||
| All previous years | 11.6 | 14.4 | 16.6 | 21.1 | 18.8 | 17.5 | 23.6 | 23.8 | 20.2 | 22.5 | 17.8 | 9.6 | 11.6 | 19.1 | 21.5 | 20.4 | 18.5 | ||
| Previous 30 years | 11.6 | 14.5 | 16.5 | 20.9 | 18.3 | 17.3 | 23.4 | 23.8 | 20.0 | 22.3 | 17.6 | 9.6 | 11.6 | 18.8 | 21.3 | 20.2 | 18.4 | ||
| Previous 20 years | 10.6 | 14.6 | 14.7 | 18.8 | 16.1 | 15.2 | 22.3 | 21.7 | 18.0 | 20.0 | 16.5 | 8.0 | 10.6 | 16.9 | 19.6 | 18.4 | 16.7 | ||
| 10 year groups | |||||||||||||||||||
| [2007,2017) | 11.7 | 15.5 | 16.3 | 19.3 | 18.0 | 17.1 | 23.5 | 23.0 | 20.2 | 20.2 | 17.2 | 8.3 | 11.3 | 18.1 | 21.2 | 19.5 | 18.0 | ||
| [1997,2007) | 8.7 | 12.6 | 11.7 | 17.0 | 12.4 | 11.5 | 18.0 | 18.5 | 13.2 | 19.5 | 14.7 | 7.3 | 9.2 | 13.7 | 15.3 | 15.7 | 13.6 | ||
| [1987,1997) | 15.1 | 14.0 | 25.8 | 33.1 | 25.4 | 29.2 | 30.2 | 33.2 | 31.1 | 34.2 | 21.8 | 17.9 | 15.6 | 28.2 | 30.8 | 29.3 | 26.1 | ||
| 5 year groups | |||||||||||||||||||
| [2012,2017) | 13.4 | 17.1 | 18.5 | 21.6 | 21.0 | 21.2 | 23.0 | 22.4 | 21.5 | 21.9 | 16.1 | 8.4 | 12.6 | 20.5 | 22.3 | 20.3 | 19.5 | ||
| [2007,2012) | 7.1 | 10.0 | 11.2 | 15.4 | 9.7 | 8.3 | 25.5 | 25.7 | 16.4 | 16.2 | 20.5 | 8.0 | 8.2 | 13.2 | 18.0 | 17.2 | 14.3 | ||
| [2002,2007) | 8.3 | 11.1 | 10.5 | 17.0 | 12.7 | 11.1 | 16.1 | 15.9 | 10.9 | 18.9 | 13.1 | 5.7 | 7.9 | 13.5 | 13.8 | 14.1 | 12.5 | ||
| [1997,2002) | 9.4 | 14.2 | 13.0 | 16.9 | 12.1 | 12.0 | 20.2 | 21.1 | 16.3 | 20.2 | 16.8 | 9.5 | 10.9 | 14.0 | 17.1 | 17.8 | 15.1 | ||
| [1992,1997) | 8.9 | 6.9 | 6.9 | 17.1 | 12.0 | 13.5 | 16.4 | 14.0 | 13.9 | 16.7 | 11.7 | 6.3 | 7.3 | 12.5 | 14.7 | 14.2 | 12.2 | ||
| [1987,1992) | 17.9 | 17.9 | 34.7 | 41.8 | 31.9 | 36.1 | 37.7 | 40.5 | 41.4 | 44.1 | 27.1 | 24.5 | 20.0 | 36.1 | 38.1 | 37.7 | 33.2 | ||
| Year | |||||||||||||||||||
| 2017 | 12.1 | 15.2 | 13.7 | 20.4 | 19.9 | 17.2 | 24.4 | 19.8 | 16.2 | 22.7 | 12.8 | 8.1 | 11.4 | 18.2 | 20.7 | 17.2 | 17.2 | ||
| 2016 | 12.0 | 14.7 | 18.9 | 20.3 | 20.7 | 19.1 | 22.8 | 22.4 | 20.6 | 18.4 | 11.5 | 8.9 | 12.0 | 20.0 | 21.7 | 17.4 | 18.2 | ||
| 2015 | 9.6 | 19.9 | 20.4 | 19.6 | 17.4 | 22.8 | 18.0 | 22.4 | 21.1 | 22.3 | 17.4 | 8.5 | 11.9 | 19.3 | 20.8 | 20.5 | 18.6 | ||
| 2014 | 15.2 | 19.7 | 13.2 | 24.2 | 22.2 | 22.3 | 26.9 | 18.6 | 20.4 | 26.9 | 18.0 | 8.1 | 13.1 | 20.5 | 23.5 | 22.0 | 20.5 | ||
| 2013 | 16.8 | 12.2 | 19.5 | 23.5 | 20.8 | 23.2 | 27.7 | 26.7 | 25.1 | 27.2 | 25.1 | 5.4 | 11.0 | 21.6 | 25.7 | 25.9 | 22.3 | ||
| 2012 | 19.0 | 21.3 | 18.3 | 22.8 | 27.0 | 19.1 | 22.2 | 22.4 | 22.0 | 21.2 | 18.7 | 10.2 | 16.2 | 22.6 | 21.2 | 21.0 | 20.7 | ||
| 2011 | 9.8 | 9.6 | 13.2 | 17.0 | 9.1 | 15.2 | 39.9 | 38.8 | 27.8 | 27.6 | 29.5 | 14.5 | 12.5 | 14.5 | 30.3 | 28.2 | 22.2 | ||
| 2010 | 7.3 | 5.3 | 10.5 | 17.1 | 6.7 | 7.3 | 18.8 | 12.9 | 10.2 | 10.2 | 11.8 | 5.3 | 5.7 | 12.9 | 12.3 | 10.5 | 10.9 | ||
| 2009 | 7.2 | 22.9 | 13.2 | 12.3 | 10.3 | 4.2 | 20.7 | 18.3 | 15.8 | 9.8 | 8.4 | 2.3 | 8.1 | 12.1 | 13.3 | 11.7 | 11.5 | ||
| 2008 | 6.9 | 6.1 | 9.7 | 14.1 | 10.1 | 5.9 | 23.8 | 22.2 | 11.3 | 15.5 | 18.0 | 9.3 | 7.8 | 12.3 | 14.7 | 14.7 | 12.5 | ||
| 2007 | 3.3 | 8.3 | 9.1 | 17.4 | 13.5 | 5.7 | 15.4 | 20.9 | 12.3 | 14.1 | 22.8 | 6.2 | 6.1 | 14.3 | 12.0 | 15.2 | 12.3 | ||
| 2006 | 3.9 | 6.8 | 8.8 | 16.9 | 9.5 | 8.4 | 20.8 | 17.8 | 12.3 | 15.1 | 13.8 | 5.7 | 5.4 | 13.0 | 15.4 | 13.4 | 12.0 | ||
| 2005 | 9.6 | 9.3 | 7.4 | 10.5 | 13.1 | 8.8 | 17.7 | 15.2 | 9.1 | 26.2 | 12.9 | 3.4 | 6.3 | 9.7 | 12.6 | 15.4 | 11.2 | ||
| 2004 | 8.3 | 9.9 | 8.2 | 18.6 | 9.3 | 6.9 | 10.9 | 13.1 | 7.3 | 13.2 | 8.7 | 3.7 | 7.4 | 11.8 | 9.6 | 9.8 | 9.6 | ||
| 2003 | 11.1 | 14.4 | 11.4 | 17.6 | 10.6 | 14.4 | 12.6 | 17.0 | 11.7 | 20.7 | 10.1 | 5.0 | 9.8 | 13.0 | 14.8 | 14.8 | 13.3 | ||
| 2002 | 9.1 | 14.4 | 17.9 | 20.6 | 20.5 | 14.7 | 17.6 | 15.1 | 13.2 | 19.0 | 22.4 | 11.3 | 11.3 | 19.7 | 15.5 | 16.9 | 16.1 | ||
| 2001 | 8.9 | 15.1 | 13.1 | 18.5 | 17.0 | 19.2 | 23.5 | 19.6 | 14.8 | 22.0 | 15.6 | 6.4 | 9.8 | 15.7 | 20.6 | 17.0 | 16.0 | ||
| 2000 | 15.9 | 21.6 | 16.3 | 21.6 | 16.7 | 10.0 | 19.4 | 23.8 | 22.0 | 24.3 | 13.6 | 14.0 | 17.0 | 18.2 | 16.9 | 21.3 | 18.3 | ||
| 1999 | 5.9 | 9.3 | 13.8 | 11.9 | 11.0 | 11.2 | 19.7 | 24.3 | 15.1 | 20.6 | 22.7 | 12.1 | 10.7 | 12.3 | 18.1 | 19.5 | 15.6 | ||
| 1998 | 8.1 | 5.7 | 9.8 | 9.8 | 4.4 | 3.8 | 20.6 | 11.3 | 8.6 | 5.1 | 3.7 | 4.0 | 5.5 | 7.9 | 10.6 | 6.9 | 8.0 | ||
| 1997 | 3.4 | 8.6 | 9.1 | 17.1 | 5.1 | 7.7 | 11.8 | 17.5 | 17.5 | 12.8 | 13.3 | 4.2 | 5.1 | 9.6 | 11.3 | 13.9 | 9.8 | ||
| 1996 | 4.5 | 6.4 | 9.3 | 14.9 | 8.3 | 8.1 | 10.7 | 11.8 | 4.9 | 12.5 | 10.3 | 4.6 | 5.2 | 11.1 | 10.1 | 8.5 | 8.9 | ||
| 1995 | 9.7 | 3.1 | 2.9 | 11.0 | 10.0 | 12.6 | 20.4 | 6.3 | 12.2 | 11.3 | 7.8 | 4.3 | 5.4 | 8.5 | 14.4 | 10.7 | 9.5 | ||
| 1994 | 9.8 | 16.9 | 11.8 | 15.1 | 8.1 | 17.4 | 22.1 | 20.7 | 14.8 | 10.7 | 6.2 | 6.7 | 11.1 | 11.0 | 20.3 | 10.7 | 12.6 | ||
| 1993 | 12.2 | 5.1 | 3.2 | 24.0 | 18.2 | 19.6 | 20.4 | 25.0 | 14.8 | 28.3 | 9.1 | 10.1 | 8.7 | 15.8 | 21.3 | 16.5 | 15.1 | ||
| 1992 | 9.2 | 5.6 | 8.2 | 26.6 | 22.2 | 15.9 | 8.6 | 12.2 | 26.8 | 33.9 | 25.0 | 6.7 | 7.3 | 19.1 | 12.3 | 28.2 | 17.4 | ||
| 1991 | 11.8 | 8.5 | 16.3 | 15.5 | 9.3 | 16.2 | 19.6 | 32.0 | 22.2 | 28.8 | 18.0 | 14.0 | 11.1 | 13.6 | 21.7 | 23.0 | 16.3 | ||
| 1990 | 18.7 | 17.3 | 17.2 | 26.5 | 29.9 | 23.6 | 34.7 | 28.2 | 18.2 | 26.2 | 19.2 | 15.8 | 17.5 | 24.8 | 28.8 | 21.2 | 22.2 | ||
| 1989 | 16.8 | 21.1 | 36.7 | 41.5 | 33.3 | 34.8 | 38.8 | 41.8 | 46.1 | 51.3 | 26.3 | 28.0 | 21.6 | 37.6 | 38.2 | 42.3 | 34.8 | ||
| 1988 | 21.1 | 18.3 | 42.7 | 49.6 | 31.5 | 41.0 | 39.7 | 40.0 | 49.0 | 47.6 | 28.8 | 26.6 | 21.6 | 40.7 | 40.2 | 41.7 | 35.6 | ||
| 1987 | 27.3 | 26.7 | 40.1 | 50.8 | 38.5 | 44.1 | 41.0 | 45.4 | 45.5 | 45.7 | 31.0 | 25.5 | 25.7 | 42.7 | 43.7 | 40.7 | 40.8 | ||
| 1986 | 15.4 | 15.8 | 28.3 | 55.6 | 83.0 | 61.8 | 65.2 | 52.8 | 51.6 | 52.9 | 41.4 | 22.9 | 18.2 | 54.4 | 59.1 | 49.5 | 46.0 | ||
| 1985 | 10.0 | 13.3 | 19.2 | 31.4 | 28.1 | 31.7 | 12.5 | 29.4 | 18.2 | 15.8 | 20.0 | 7.1 | 10.2 | 27.2 | 29.4 | 17.5 | 23.0 | ||
| 1984 | 0.0 | 0.0 | 0.0 | 0.0 | 0.0 | 0.0 | 41.4 | 15.2 | 51.9 | 26.5 | 32.3 | 5.9 | 4.1 | 0.0 | 23.0 | 35.9 | 22.0 | ||
| 1983 | 0.0 | 0.0 | 0.0 | 7.7 | 33.3 | 15.4 | 0.0 | 0.0 | 0.0 | - | 0.0 | 0.0 | 0.0 | 14.8 | 6.7 | 0.0 | 6.0 | ||
| 1982 | - | 0.0 | - | 0.0 | 0.0 | 0.0 | - | 0.0 | - | 0.0 | - | 0.0 | 0.0 | 0.0 | 0.0 | 0.0 | 0.0 | ||
Breeding data
Breeding records by month
Number of breeding records by breeding code and month, 2017 and all years| Breeding code | Jul | Aug | Sep | Oct | Nov | Dec | Jan | Feb | Mar | Apr | May | Jun |
|---|---|---|---|---|---|---|---|---|---|---|---|---|
| 2017 | ||||||||||||
| Breeding (BLA code) | 0 | 0 | 0 | 0 | 0 | 0 | 0 | 0 | 0 | 0 | 0 | 0 |
| Carrying Food | 0 | 0 | 0 | 0 | 0 | 0 | 0 | 0 | 0 | 0 | 0 | 0 |
| Copulating | 0 | 0 | 0 | 0 | 0 | 0 | 0 | 0 | 0 | 0 | 0 | 0 |
| Display | 0 | 0 | 0 | 0 | 0 | 0 | 0 | 0 | 0 | 0 | 0 | 0 |
| Dependent young | 0 | 0 | 0 | 1 | 0 | 0 | 1 | 2 | 0 | 0 | 0 | 0 |
| Faecal sac | 0 | 0 | 0 | 0 | 0 | 0 | 0 | 0 | 0 | 0 | 0 | 0 |
| Inspecting hollow | 0 | 0 | 0 | 0 | 0 | 0 | 0 | 0 | 0 | 0 | 0 | 0 |
| Nest building | 0 | 0 | 0 | 0 | 0 | 0 | 0 | 0 | 0 | 0 | 0 | 0 |
| Nest with eggs | 0 | 0 | 0 | 0 | 0 | 0 | 0 | 0 | 0 | 0 | 0 | 0 |
| Nest with young | 0 | 0 | 0 | 0 | 0 | 0 | 0 | 1 | 0 | 0 | 0 | 0 |
| On/leaving nest | 0 | 0 | 0 | 0 | 0 | 0 | 1 | 0 | 0 | 0 | 0 | 0 |
| All years | ||||||||||||
| Breeding (BLA code) | 0 | 0 | 0 | 1 | 1 | 3 | 1 | 1 | 0 | 0 | 0 | 0 |
| Carrying Food | 0 | 0 | 0 | 2 | 0 | 2 | 2 | 0 | 0 | 1 | 0 | 0 |
| Copulating | 0 | 0 | 0 | 0 | 0 | 0 | 0 | 0 | 0 | 0 | 0 | 0 |
| Display | 0 | 0 | 0 | 0 | 0 | 0 | 0 | 0 | 0 | 0 | 0 | 0 |
| Dependent young | 0 | 0 | 1 | 9 | 11 | 21 | 29 | 33 | 7 | 1 | 0 | 1 |
| Faecal sac | 0 | 0 | 0 | 0 | 0 | 0 | 0 | 0 | 0 | 0 | 0 | 0 |
| Inspecting hollow | 0 | 0 | 0 | 0 | 0 | 0 | 0 | 0 | 0 | 0 | 0 | 0 |
| Nest building | 0 | 0 | 6 | 7 | 6 | 5 | 4 | 1 | 0 | 0 | 0 | 0 |
| Nest with eggs | 0 | 0 | 0 | 1 | 2 | 3 | 1 | 0 | 0 | 0 | 0 | 0 |
| Nest with young | 0 | 0 | 0 | 3 | 2 | 3 | 2 | 3 | 0 | 0 | 0 | 0 |
| On/leaving nest | 0 | 0 | 0 | 1 | 0 | 0 | 1 | 0 | 0 | 0 | 0 | 0 |
Breeding records by year
Average number of breeding records per period by breeding code| Period | Breeding (BLA code) | Carrying Food | Copulating | Display | Dependent young | Faecal sac | Inspecting hollow | Nest building | Nest with eggs | Nest with young | On/leaving nest |
|---|---|---|---|---|---|---|---|---|---|---|---|
| All years | |||||||||||
| All | 0.2 | 0.2 | 0.0 | 0.0 | 3.1 | 0.0 | 0.0 | 0.8 | 0.2 | 0.4 | 0.1 |
| Previous years | |||||||||||
| All previous years | 0.2 | 0.2 | 0.0 | 0.0 | 3.1 | 0.0 | 0.0 | 0.8 | 0.2 | 0.3 | 0.0 |
| Previous 30 years | 0.2 | 0.2 | 0.0 | 0.0 | 3.6 | 0.0 | 0.0 | 0.8 | 0.2 | 0.4 | 0.0 |
| Previous 20 years | 0.3 | 0.2 | 0.0 | 0.0 | 1.1 | 0.0 | 0.0 | 0.1 | 0.0 | 0.2 | 0.0 |
| 10 year groups | |||||||||||
| [2007,2017) | 0.0 | 0.4 | 0.0 | 0.0 | 1.7 | 0.0 | 0.0 | 0.1 | 0.0 | 0.0 | 0.1 |
| [1997,2007) | 0.7 | 0.1 | 0.0 | 0.0 | 0.6 | 0.0 | 0.0 | 0.2 | 0.0 | 0.4 | 0.0 |
| [1987,1997) | 0.0 | 0.2 | 0.0 | 0.0 | 8.4 | 0.0 | 0.0 | 2.0 | 0.7 | 0.8 | 0.0 |
| 5 year groups | |||||||||||
| [2012,2017) | 0.0 | 0.6 | 0.0 | 0.0 | 1.8 | 0.0 | 0.0 | 0.0 | 0.0 | 0.0 | 0.2 |
| [2007,2012) | 0.0 | 0.2 | 0.0 | 0.0 | 1.6 | 0.0 | 0.0 | 0.2 | 0.0 | 0.0 | 0.0 |
| [2002,2007) | 0.8 | 0.2 | 0.0 | 0.0 | 0.8 | 0.0 | 0.0 | 0.2 | 0.0 | 0.6 | 0.0 |
| [1997,2002) | 0.6 | 0.0 | 0.0 | 0.0 | 0.4 | 0.0 | 0.0 | 0.2 | 0.0 | 0.2 | 0.0 |
| [1992,1997) | 0.0 | 0.0 | 0.0 | 0.0 | 0.4 | 0.0 | 0.0 | 0.4 | 0.0 | 0.2 | 0.0 |
| [1987,1992) | 0.0 | 0.4 | 0.0 | 0.0 | 16.4 | 0.0 | 0.0 | 3.6 | 1.4 | 1.4 | 0.0 |
| Year | |||||||||||
| 2017 | 0.0 | 0.0 | 0.0 | 0.0 | 4.0 | 0.0 | 0.0 | 0.0 | 0.0 | 1.0 | 1.0 |
| 2016 | 0.0 | 3.0 | 0.0 | 0.0 | 4.0 | 0.0 | 0.0 | 0.0 | 0.0 | 0.0 | 0.0 |
| 2015 | 0.0 | 0.0 | 0.0 | 0.0 | 0.0 | 0.0 | 0.0 | 0.0 | 0.0 | 0.0 | 0.0 |
| 2014 | 0.0 | 0.0 | 0.0 | 0.0 | 2.0 | 0.0 | 0.0 | 0.0 | 0.0 | 0.0 | 0.0 |
| 2013 | 0.0 | 0.0 | 0.0 | 0.0 | 2.0 | 0.0 | 0.0 | 0.0 | 0.0 | 0.0 | 1.0 |
| 2012 | 0.0 | 0.0 | 0.0 | 0.0 | 1.0 | 0.0 | 0.0 | 0.0 | 0.0 | 0.0 | 0.0 |
| 2011 | 0.0 | 0.0 | 0.0 | 0.0 | 1.0 | 0.0 | 0.0 | 0.0 | 0.0 | 0.0 | 0.0 |
| 2010 | 0.0 | 0.0 | 0.0 | 0.0 | 1.0 | 0.0 | 0.0 | 0.0 | 0.0 | 0.0 | 0.0 |
| 2009 | 0.0 | 1.0 | 0.0 | 0.0 | 1.0 | 0.0 | 0.0 | 0.0 | 0.0 | 0.0 | 0.0 |
| 2008 | 0.0 | 0.0 | 0.0 | 0.0 | 5.0 | 0.0 | 0.0 | 1.0 | 0.0 | 0.0 | 0.0 |
| 2007 | 0.0 | 0.0 | 0.0 | 0.0 | 0.0 | 0.0 | 0.0 | 0.0 | 0.0 | 0.0 | 0.0 |
| 2006 | 0.0 | 1.0 | 0.0 | 0.0 | 0.0 | 0.0 | 0.0 | 0.0 | 0.0 | 0.0 | 0.0 |
| 2005 | 0.0 | 0.0 | 0.0 | 0.0 | 1.0 | 0.0 | 0.0 | 1.0 | 0.0 | 1.0 | 0.0 |
| 2004 | 0.0 | 0.0 | 0.0 | 0.0 | 0.0 | 0.0 | 0.0 | 0.0 | 0.0 | 2.0 | 0.0 |
| 2003 | 1.0 | 0.0 | 0.0 | 0.0 | 1.0 | 0.0 | 0.0 | 0.0 | 0.0 | 0.0 | 0.0 |
| 2002 | 3.0 | 0.0 | 0.0 | 0.0 | 2.0 | 0.0 | 0.0 | 0.0 | 0.0 | 0.0 | 0.0 |
| 2001 | 1.0 | 0.0 | 0.0 | 0.0 | 2.0 | 0.0 | 0.0 | 0.0 | 0.0 | 0.0 | 0.0 |
| 2000 | 1.0 | 0.0 | 0.0 | 0.0 | 0.0 | 0.0 | 0.0 | 0.0 | 0.0 | 0.0 | 0.0 |
| 1999 | 1.0 | 0.0 | 0.0 | 0.0 | 0.0 | 0.0 | 0.0 | 0.0 | 0.0 | 0.0 | 0.0 |
| 1998 | 0.0 | 0.0 | 0.0 | 0.0 | 0.0 | 0.0 | 0.0 | 0.0 | 0.0 | 0.0 | 0.0 |
| 1997 | 0.0 | 0.0 | 0.0 | 0.0 | 0.0 | 0.0 | 0.0 | 1.0 | 0.0 | 1.0 | 0.0 |
| 1996 | 0.0 | 0.0 | 0.0 | 0.0 | 0.0 | 0.0 | 0.0 | 0.0 | 0.0 | 0.0 | 0.0 |
| 1995 | 0.0 | 0.0 | 0.0 | 0.0 | 0.0 | 0.0 | 0.0 | 0.0 | 0.0 | 1.0 | 0.0 |
| 1994 | 0.0 | 0.0 | 0.0 | 0.0 | 0.0 | 0.0 | 0.0 | 2.0 | 0.0 | 0.0 | 0.0 |
| 1993 | 0.0 | 0.0 | 0.0 | 0.0 | 1.0 | 0.0 | 0.0 | 0.0 | 0.0 | 0.0 | 0.0 |
| 1992 | 0.0 | 0.0 | 0.0 | 0.0 | 1.0 | 0.0 | 0.0 | 0.0 | 0.0 | 0.0 | 0.0 |
| 1991 | 0.0 | 0.0 | 0.0 | 0.0 | 5.0 | 0.0 | 0.0 | 0.0 | 0.0 | 0.0 | 0.0 |
| 1990 | 0.0 | 0.0 | 0.0 | 0.0 | 13.0 | 0.0 | 0.0 | 0.0 | 0.0 | 0.0 | 0.0 |
| 1989 | 0.0 | 1.0 | 0.0 | 0.0 | 20.0 | 0.0 | 0.0 | 7.0 | 1.0 | 0.0 | 0.0 |
| 1988 | 0.0 | 0.0 | 0.0 | 0.0 | 21.0 | 0.0 | 0.0 | 3.0 | 2.0 | 3.0 | 0.0 |
| 1987 | 0.0 | 1.0 | 0.0 | 0.0 | 23.0 | 0.0 | 0.0 | 8.0 | 4.0 | 4.0 | 0.0 |
| 1986 | 0.0 | 0.0 | 0.0 | 0.0 | 1.0 | 0.0 | 0.0 | 5.0 | 0.0 | 0.0 | 0.0 |
| 1985 | 0.0 | 0.0 | 0.0 | 0.0 | 1.0 | 0.0 | 0.0 | 1.0 | 0.0 | 0.0 | 0.0 |
| 1984 | 0.0 | 0.0 | 0.0 | 0.0 | 0.0 | 0.0 | 0.0 | 0.0 | 0.0 | 0.0 | 0.0 |
| 1983 | 0.0 | 0.0 | 0.0 | 0.0 | 0.0 | 0.0 | 0.0 | 0.0 | 0.0 | 0.0 | 0.0 |
| 1982 | 0.0 | 0.0 | 0.0 | 0.0 | 0.0 | 0.0 | 0.0 | 0.0 | 0.0 | 0.0 | 0.0 |
Distribution map
Distribution - 2017
This map shows the observed distribution of the Silvereye for 2017.
The red circles are the grid cells where Silvereye have been reported.
The transparency of the red circles indicate how many surveys sheets were submitted for that grid cell; the darker the red the more reliable the data. Of the 315 grid cells with reports, 83 had only one sheet; an example is grid number E21.
The size of the circle represents the reporting rate. The maximum reporting rate for Silvereye was 100.0% (eg grid number E21) and the minimum was 0.7% (eg grid number S13). 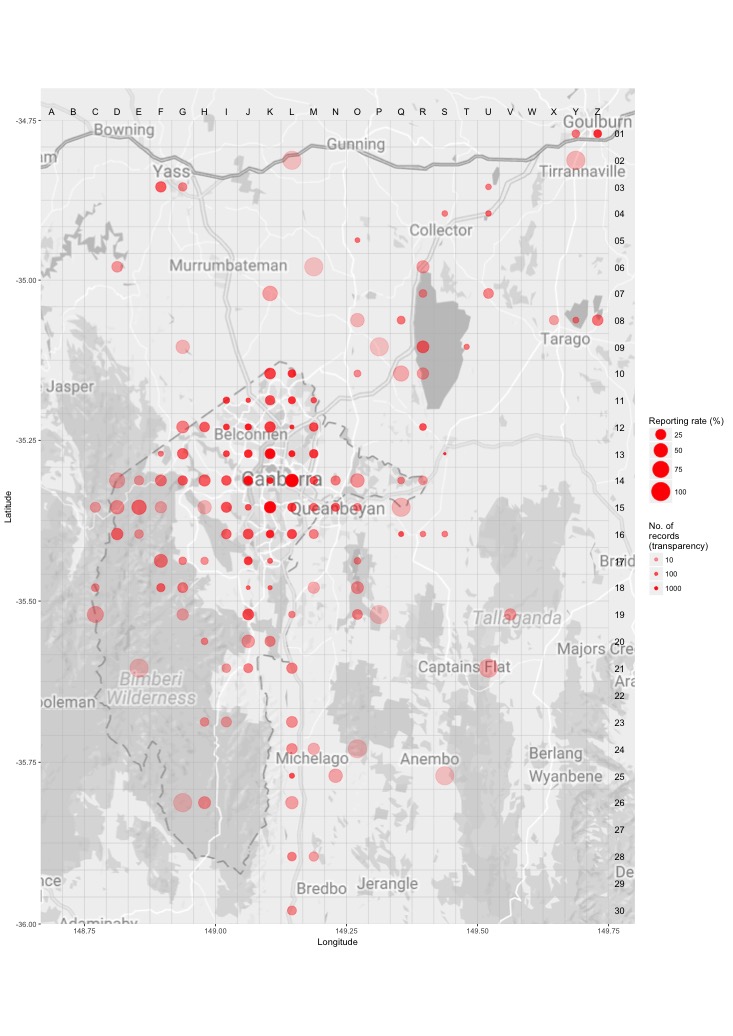
Distribution - all years
This map shows the observed distribution of the Silvereye for all years.
The red circles are the grid cells where Silvereye have been reported.
The transparency of the red circles indicate how many surveys sheets were submitted for that grid cell; the darker the red the more reliable the data. Of the 703 grid cells with reports, 55 had only one sheet; an example is grid number C10.
The size of the circle represents the reporting rate. The maximum reporting rate for Silvereye was 100.0% (eg grid number C10) and the minimum was 0.5% (eg grid number P12). 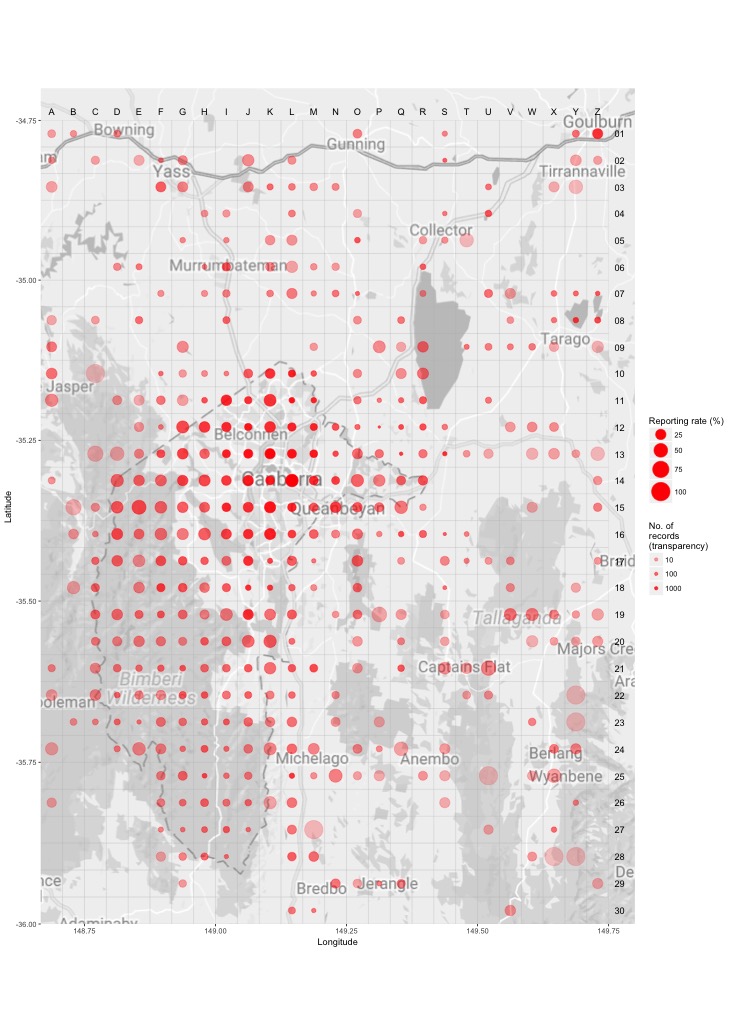
Breeding map
Breeding - 2017
This map shows the breeding distribution of the Silvereye for 2017.
The red circles are the grid cells where breeding activity for Silvereye have been reported.
The size of the circle represents the number of reports. 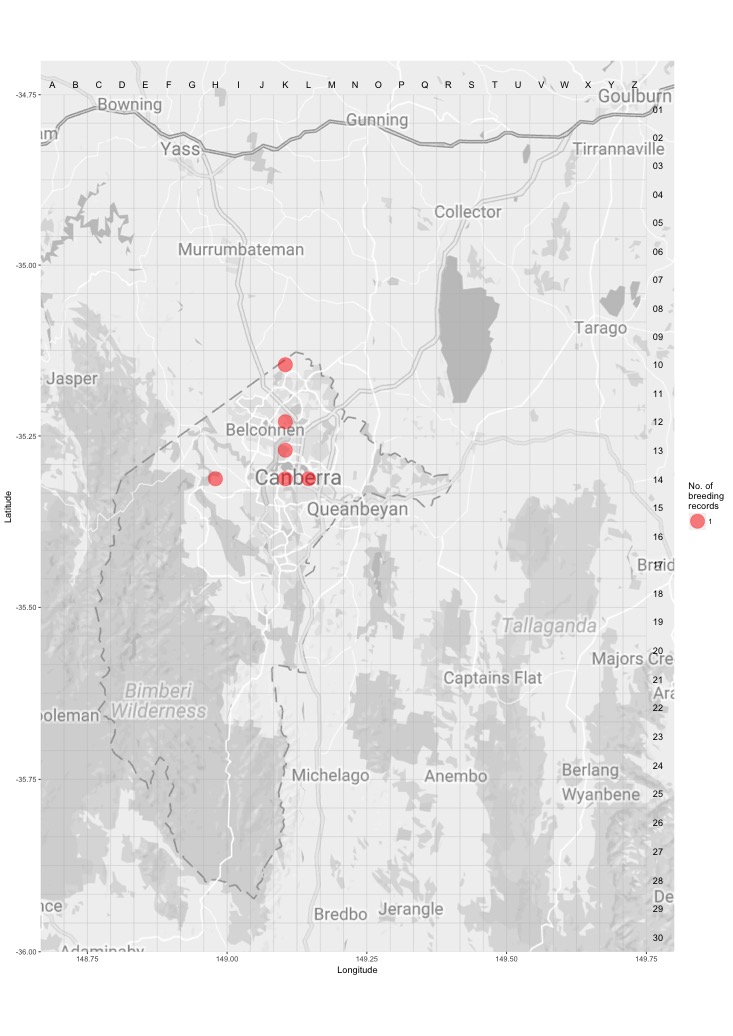
Breeding - all years
This map shows the breeding distribution of the Silvereye for all years.
The red circles are the grid cells where breeding activity for Silvereye have been reported.
The size of the circle represents the number of reports. 