Mistletoebird
Dicaeum hirundinaceum
ABR description
The following is extracted from the Annual Bird Report for the twelve months to June 2017.
Common, breeding summer migrant
Occurs where there is mistletoe in the ACT and AoI.
General: A continuing fall in most metrics from general and GBS records. 221 records down from 254 records last year from 49 grids down from 59 grids last year. 376 individuals counted, down on 404 last year. Abundance is down 23% on last year and down 62% on the 30YA, and is just about as low as it has ever been. The reporting rate (1.6%) is down 28% on last year and down 69% on the 30YA, its lowest level since systematic records began. Max 20/21 Dec Stony Creek Nature Reserve GrG13 (CoF1). Most sightings are of single birds. Present throughout the year with most sightings in spring 46% and summer 35%. 1 breeding record: nb/10 Dec Campbell Park (SmA1).
GBS: 20 records, down from 25 records last year. Abundance is down 13% on last year and down 68% on the 30YA. The reporting rate is down 9% on last year and down 65% on the 30YA. Breeding not recorded, with single historical breeding records in the GBS in both 2009 and 2013.

Abundance
Abundance is the average number of birds of that species per survey. Where the species was observed (presence recorded) but the number of birds seen was not recorded, this is treated as a count of zero.
Abundance by year
This chart shows the abundance of Mistletoebird between 1982 and 2017. 
Abundance by month
This chart shows the monthly abundance of Mistletoebird. The blue lines show the abundance for the twelve months to June 2017 and the bars show the average abundance for the period 1982 to 2017. 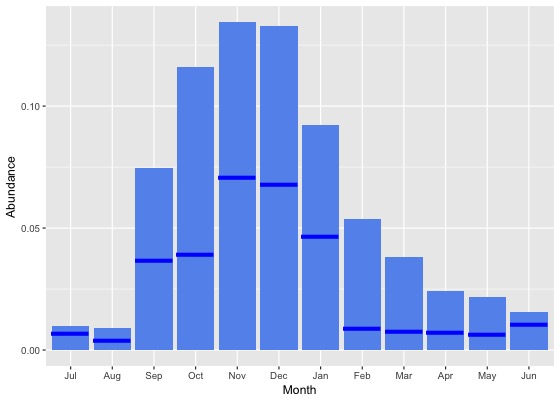
Abundance by season
This chart shows the seasonal abundance of Mistletoebird. The blue lines show the seasonal abundance for the twelve months to June 2017 and the bars show the average seasonal abundance for the period 1982 to 2017. 
Abundance data
| Month | Season | ||||||||||||||||||
|---|---|---|---|---|---|---|---|---|---|---|---|---|---|---|---|---|---|---|---|
| Period | Jul | Aug | Sep | Oct | Nov | Dec | Jan | Feb | Mar | Apr | May | Jun | Winter | Spring | Summer | Autumn | All | ||
| All years | |||||||||||||||||||
| All | 0.0 | 0.0 | 0.1 | 0.1 | 0.1 | 0.1 | 0.1 | 0.1 | 0.0 | 0.0 | 0.0 | 0.0 | 0.0 | 0.1 | 0.1 | 0.0 | 0.1 | ||
| Previous years | |||||||||||||||||||
| All previous years | 0.0 | 0.0 | 0.1 | 0.1 | 0.1 | 0.1 | 0.1 | 0.1 | 0.0 | 0.0 | 0.0 | 0.0 | 0.0 | 0.1 | 0.1 | 0.0 | 0.1 | ||
| Previous 30 years | 0.0 | 0.0 | 0.1 | 0.1 | 0.1 | 0.1 | 0.1 | 0.1 | 0.0 | 0.0 | 0.0 | 0.0 | 0.0 | 0.1 | 0.1 | 0.0 | 0.1 | ||
| Previous 20 years | 0.0 | 0.0 | 0.1 | 0.1 | 0.1 | 0.1 | 0.1 | 0.0 | 0.0 | 0.0 | 0.0 | 0.0 | 0.0 | 0.1 | 0.1 | 0.0 | 0.1 | ||
| 10 year groups | |||||||||||||||||||
| [2007,2017) | 0.0 | 0.0 | 0.1 | 0.1 | 0.1 | 0.1 | 0.1 | 0.0 | 0.0 | 0.0 | 0.0 | 0.0 | 0.0 | 0.1 | 0.1 | 0.0 | 0.1 | ||
| [1997,2007) | 0.0 | 0.0 | 0.1 | 0.1 | 0.2 | 0.2 | 0.1 | 0.1 | 0.0 | 0.0 | 0.0 | 0.0 | 0.0 | 0.1 | 0.1 | 0.0 | 0.1 | ||
| [1987,1997) | 0.0 | 0.0 | 0.0 | 0.1 | 0.1 | 0.1 | 0.1 | 0.1 | 0.1 | 0.0 | 0.0 | 0.0 | 0.0 | 0.1 | 0.1 | 0.0 | 0.1 | ||
| 5 year groups | |||||||||||||||||||
| [2012,2017) | 0.0 | 0.0 | 0.1 | 0.1 | 0.1 | 0.1 | 0.1 | 0.0 | 0.0 | 0.0 | 0.0 | 0.0 | 0.0 | 0.1 | 0.1 | 0.0 | 0.1 | ||
| [2007,2012) | 0.0 | 0.0 | 0.1 | 0.1 | 0.1 | 0.1 | 0.1 | 0.0 | 0.0 | 0.0 | 0.0 | 0.0 | 0.0 | 0.1 | 0.1 | 0.0 | 0.1 | ||
| [2002,2007) | 0.0 | 0.0 | 0.1 | 0.1 | 0.1 | 0.2 | 0.1 | 0.0 | 0.0 | 0.0 | 0.0 | 0.0 | 0.0 | 0.1 | 0.1 | 0.0 | 0.1 | ||
| [1997,2002) | 0.0 | 0.0 | 0.1 | 0.2 | 0.2 | 0.2 | 0.1 | 0.2 | 0.0 | 0.0 | 0.0 | 0.0 | 0.0 | 0.1 | 0.2 | 0.0 | 0.1 | ||
| [1992,1997) | 0.0 | 0.0 | 0.0 | 0.1 | 0.1 | 0.1 | 0.1 | 0.1 | 0.0 | 0.0 | 0.0 | 0.0 | 0.0 | 0.1 | 0.1 | 0.0 | 0.0 | ||
| [1987,1992) | 0.0 | 0.0 | 0.0 | 0.1 | 0.1 | 0.1 | 0.1 | 0.1 | 0.1 | 0.0 | 0.0 | 0.0 | 0.0 | 0.1 | 0.1 | 0.1 | 0.1 | ||
| Year | |||||||||||||||||||
| 2017 | 0.0 | 0.0 | 0.0 | 0.0 | 0.1 | 0.1 | 0.0 | 0.0 | 0.0 | 0.0 | 0.0 | 0.0 | 0.0 | 0.0 | 0.0 | 0.0 | 0.0 | ||
| 2016 | 0.0 | 0.0 | 0.0 | 0.1 | 0.1 | 0.1 | 0.0 | 0.0 | 0.0 | 0.0 | 0.0 | 0.0 | 0.0 | 0.1 | 0.0 | 0.0 | 0.0 | ||
| 2015 | 0.0 | 0.0 | 0.1 | 0.3 | 0.2 | 0.2 | 0.1 | 0.0 | 0.0 | 0.0 | 0.0 | 0.0 | 0.0 | 0.2 | 0.1 | 0.0 | 0.1 | ||
| 2014 | 0.0 | 0.0 | 0.2 | 0.1 | 0.3 | 0.3 | 0.2 | 0.0 | 0.0 | 0.0 | 0.0 | 0.0 | 0.0 | 0.2 | 0.2 | 0.0 | 0.1 | ||
| 2013 | 0.0 | 0.0 | 0.0 | 0.1 | 0.2 | 0.1 | 0.1 | 0.0 | 0.0 | 0.0 | 0.0 | 0.0 | 0.0 | 0.1 | 0.1 | 0.0 | 0.1 | ||
| 2012 | 0.0 | 0.0 | 0.0 | 0.0 | 0.1 | 0.1 | 0.0 | 0.1 | 0.0 | 0.0 | 0.0 | 0.0 | 0.0 | 0.0 | 0.0 | 0.0 | 0.0 | ||
| 2011 | 0.0 | 0.0 | 0.1 | 0.2 | 0.2 | 0.1 | 0.1 | 0.0 | 0.0 | 0.0 | 0.0 | 0.0 | 0.0 | 0.2 | 0.1 | 0.0 | 0.1 | ||
| 2010 | 0.0 | 0.0 | 0.1 | 0.1 | 0.2 | 0.1 | 0.1 | 0.0 | 0.0 | 0.0 | 0.0 | 0.0 | 0.0 | 0.1 | 0.1 | 0.0 | 0.1 | ||
| 2009 | 0.0 | 0.0 | 0.1 | 0.1 | 0.1 | 0.1 | 0.0 | 0.0 | 0.0 | 0.0 | 0.0 | 0.0 | 0.0 | 0.1 | 0.1 | 0.0 | 0.1 | ||
| 2008 | 0.0 | 0.0 | 0.1 | 0.1 | 0.1 | 0.1 | 0.2 | 0.1 | 0.0 | 0.0 | 0.0 | 0.0 | 0.0 | 0.1 | 0.1 | 0.0 | 0.1 | ||
| 2007 | 0.0 | 0.0 | 0.1 | 0.1 | 0.1 | 0.2 | 0.0 | 0.1 | 0.0 | 0.0 | 0.1 | 0.0 | 0.0 | 0.1 | 0.1 | 0.0 | 0.1 | ||
| 2006 | 0.0 | 0.0 | 0.2 | 0.3 | 0.2 | 0.2 | 0.1 | 0.0 | 0.0 | 0.0 | 0.0 | 0.0 | 0.0 | 0.2 | 0.1 | 0.0 | 0.1 | ||
| 2005 | 0.0 | 0.0 | 0.2 | 0.0 | 0.1 | 0.2 | 0.1 | 0.0 | 0.0 | 0.0 | 0.0 | 0.0 | 0.0 | 0.1 | 0.2 | 0.0 | 0.1 | ||
| 2004 | 0.0 | 0.0 | 0.1 | 0.1 | 0.1 | 0.1 | 0.0 | 0.1 | 0.1 | 0.0 | 0.0 | 0.0 | 0.0 | 0.1 | 0.1 | 0.1 | 0.1 | ||
| 2003 | 0.0 | 0.0 | 0.1 | 0.1 | 0.2 | 0.2 | 0.1 | 0.0 | 0.0 | 0.0 | 0.0 | 0.0 | 0.0 | 0.1 | 0.1 | 0.0 | 0.1 | ||
| 2002 | 0.0 | 0.0 | 0.1 | 0.0 | 0.1 | 0.1 | 0.2 | 0.0 | 0.0 | 0.0 | 0.1 | 0.0 | 0.0 | 0.1 | 0.1 | 0.0 | 0.1 | ||
| 2001 | 0.0 | 0.0 | 0.1 | 0.1 | 0.1 | 0.3 | 0.2 | 0.2 | 0.0 | 0.0 | 0.0 | 0.0 | 0.0 | 0.1 | 0.2 | 0.0 | 0.1 | ||
| 2000 | 0.0 | 0.0 | 0.1 | 0.2 | 0.2 | 0.2 | 0.1 | 0.2 | 0.1 | 0.0 | 0.0 | 0.0 | 0.0 | 0.2 | 0.2 | 0.0 | 0.1 | ||
| 1999 | 0.0 | 0.0 | 0.2 | 0.2 | 0.2 | 0.2 | 0.1 | 0.3 | 0.0 | 0.0 | 0.0 | 0.0 | 0.0 | 0.2 | 0.2 | 0.0 | 0.1 | ||
| 1998 | 0.0 | 0.0 | 0.0 | 0.1 | 0.1 | 0.2 | 0.1 | 0.1 | 0.0 | 0.0 | 0.0 | 0.0 | 0.0 | 0.1 | 0.1 | 0.0 | 0.1 | ||
| 1997 | 0.0 | 0.0 | 0.0 | 0.1 | 0.1 | 0.1 | 0.1 | 0.0 | 0.0 | 0.0 | 0.0 | 0.0 | 0.0 | 0.1 | 0.1 | 0.0 | 0.0 | ||
| 1996 | 0.0 | 0.0 | 0.1 | 0.1 | 0.1 | 0.2 | 0.1 | 0.0 | 0.0 | 0.0 | 0.0 | 0.0 | 0.0 | 0.1 | 0.1 | 0.0 | 0.1 | ||
| 1995 | 0.0 | 0.0 | 0.0 | 0.1 | 0.1 | 0.0 | 0.1 | 0.1 | 0.0 | 0.0 | 0.0 | 0.0 | 0.0 | 0.1 | 0.1 | 0.0 | 0.0 | ||
| 1994 | 0.0 | 0.0 | 0.0 | 0.0 | 0.1 | 0.2 | 0.1 | 0.1 | 0.0 | 0.0 | 0.0 | 0.0 | 0.0 | 0.0 | 0.1 | 0.0 | 0.0 | ||
| 1993 | 0.0 | 0.0 | 0.0 | 0.1 | 0.2 | 0.1 | 0.1 | 0.1 | 0.0 | 0.0 | 0.0 | 0.0 | 0.0 | 0.1 | 0.1 | 0.0 | 0.0 | ||
| 1992 | 0.0 | 0.0 | 0.1 | 0.1 | 0.2 | 0.1 | 0.0 | 0.0 | 0.0 | 0.0 | 0.0 | 0.0 | 0.0 | 0.1 | 0.1 | 0.0 | 0.1 | ||
| 1991 | 0.0 | 0.0 | 0.0 | 0.1 | 0.2 | 0.0 | 0.3 | 0.4 | 0.0 | 0.1 | 0.0 | 0.0 | 0.0 | 0.1 | 0.2 | 0.0 | 0.1 | ||
| 1990 | 0.0 | 0.0 | 0.1 | 0.1 | 0.1 | 0.2 | 0.1 | 0.1 | 0.1 | 0.0 | 0.0 | 0.1 | 0.0 | 0.1 | 0.1 | 0.1 | 0.1 | ||
| 1989 | 0.0 | 0.0 | 0.1 | 0.2 | 0.2 | 0.2 | 0.2 | 0.2 | 0.1 | 0.1 | 0.1 | 0.1 | 0.0 | 0.2 | 0.2 | 0.1 | 0.1 | ||
| 1988 | 0.0 | 0.0 | 0.0 | 0.1 | 0.1 | 0.1 | 0.1 | 0.1 | 0.1 | 0.0 | 0.0 | 0.0 | 0.0 | 0.1 | 0.1 | 0.1 | 0.1 | ||
| 1987 | 0.0 | 0.0 | 0.0 | 0.0 | 0.1 | 0.1 | 0.1 | 0.1 | 0.1 | 0.0 | 0.0 | 0.0 | 0.0 | 0.0 | 0.1 | 0.0 | 0.0 | ||
| 1986 | 0.0 | 0.0 | 0.0 | 0.1 | 1.2 | 1.1 | 1.6 | 0.9 | 1.5 | 0.1 | 0.0 | 0.0 | 0.0 | 0.4 | 1.1 | 0.5 | 0.5 | ||
| 1985 | 0.0 | 0.0 | 0.0 | 0.0 | 0.0 | 0.0 | 0.0 | 0.0 | 0.0 | 0.0 | 0.0 | 0.0 | 0.0 | 0.0 | 0.0 | 0.0 | 0.0 | ||
| 1984 | 0.0 | 0.0 | 0.0 | 0.0 | 0.0 | 0.0 | 0.0 | 0.0 | 0.0 | 0.0 | 0.0 | 0.0 | 0.0 | 0.0 | 0.0 | 0.0 | 0.0 | ||
| 1983 | 0.0 | 0.0 | 0.0 | 0.0 | 0.1 | 0.0 | 0.0 | 0.0 | 0.0 | - | 0.0 | 0.0 | 0.0 | 0.0 | 0.0 | 0.0 | 0.0 | ||
| 1982 | - | 0.0 | - | 0.0 | 0.0 | 0.0 | - | 0.0 | - | 0.0 | - | 0.0 | 0.0 | 0.0 | 0.0 | 0.0 | 0.0 | ||
Reporting rates
Reporting rate is the proportion of all surveys in which the species was present.
Reporting rate by year
This chart shows the reporting rate of Mistletoebird each year between 1982 and 2017. 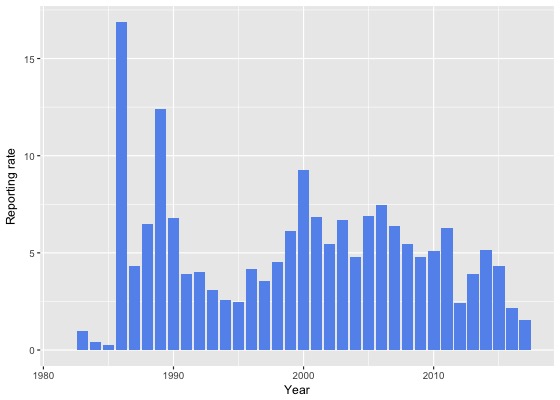
Reporting rate by month
This chart shows the reporting rate by month of Mistletoebird. The blue lines show the reporting rate for the twelve months to June 2017 and the bars show the average reporting rate for the period 1982 to 2017. 
Reporting rate by season
This chart shows the seasonal reporting rate of Mistletoebird. The blue lines show the seasonal reporting rate for the twelve months to June 2017 and the bars show the average seasonal reporting rate for the period 1982 to 2017. 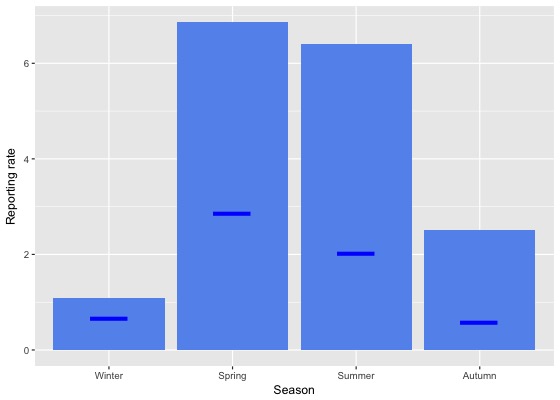
Reporting rate data
| Month | Season | ||||||||||||||||||
|---|---|---|---|---|---|---|---|---|---|---|---|---|---|---|---|---|---|---|---|
| Period | Jul | Aug | Sep | Oct | Nov | Dec | Jan | Feb | Mar | Apr | May | Jun | Winter | Spring | Summer | Autumn | All | ||
| All years | |||||||||||||||||||
| All | 1.0 | 0.8 | 5.7 | 6.7 | 8.5 | 9.3 | 5.7 | 3.8 | 3.1 | 2.3 | 1.9 | 1.4 | 1.1 | 6.9 | 6.4 | 2.5 | 4.5 | ||
| Previous years | |||||||||||||||||||
| All previous years | 1.0 | 0.9 | 6.1 | 7.2 | 9.2 | 10.2 | 6.3 | 4.4 | 3.6 | 2.6 | 2.2 | 1.5 | 1.2 | 7.4 | 7.2 | 2.9 | 5.0 | ||
| Previous 30 years | 1.0 | 0.9 | 6.2 | 7.3 | 9.0 | 10.2 | 6.2 | 4.3 | 3.5 | 2.6 | 2.2 | 1.5 | 1.2 | 7.4 | 7.1 | 2.8 | 5.0 | ||
| Previous 20 years | 1.0 | 0.9 | 6.8 | 7.3 | 8.8 | 10.1 | 5.5 | 3.3 | 2.8 | 2.4 | 2.0 | 1.3 | 1.1 | 7.5 | 6.6 | 2.4 | 4.8 | ||
| 10 year groups | |||||||||||||||||||
| [2007,2017) | 0.9 | 0.7 | 5.5 | 6.6 | 7.5 | 7.9 | 4.6 | 2.4 | 2.4 | 2.1 | 1.9 | 1.3 | 1.0 | 6.5 | 5.1 | 2.1 | 4.0 | ||
| [1997,2007) | 1.1 | 1.5 | 9.3 | 9.5 | 11.3 | 14.2 | 8.8 | 5.8 | 3.7 | 3.0 | 2.4 | 1.5 | 1.4 | 10.0 | 10.4 | 3.1 | 6.5 | ||
| [1987,1997) | 1.2 | 0.9 | 3.2 | 7.6 | 9.9 | 11.0 | 10.3 | 8.9 | 7.4 | 3.6 | 2.9 | 2.4 | 1.5 | 7.1 | 10.1 | 4.6 | 5.9 | ||
| 5 year groups | |||||||||||||||||||
| [2012,2017) | 0.7 | 0.6 | 4.1 | 6.2 | 6.8 | 6.8 | 4.1 | 1.8 | 1.8 | 1.6 | 1.6 | 1.0 | 0.8 | 5.7 | 4.3 | 1.7 | 3.4 | ||
| [2007,2012) | 1.5 | 1.1 | 8.6 | 7.4 | 9.7 | 10.2 | 6.1 | 4.9 | 3.9 | 3.2 | 2.6 | 1.8 | 1.6 | 8.2 | 7.6 | 3.3 | 5.7 | ||
| [2002,2007) | 1.2 | 1.5 | 10.6 | 9.7 | 10.4 | 12.6 | 7.7 | 3.8 | 3.2 | 3.7 | 3.0 | 2.1 | 1.7 | 10.2 | 9.0 | 3.4 | 6.3 | ||
| [1997,2002) | 1.0 | 1.5 | 7.8 | 9.3 | 12.4 | 16.3 | 10.0 | 7.8 | 4.2 | 2.2 | 1.5 | 0.5 | 1.0 | 9.7 | 12.0 | 2.9 | 6.8 | ||
| [1992,1997) | 0.9 | 0.5 | 2.0 | 4.9 | 7.1 | 7.0 | 6.1 | 4.7 | 2.0 | 1.6 | 0.8 | 0.3 | 0.5 | 4.9 | 6.0 | 1.5 | 3.2 | ||
| [1987,1992) | 1.4 | 1.1 | 3.7 | 9.0 | 11.2 | 12.8 | 12.5 | 10.5 | 10.5 | 4.7 | 3.9 | 3.7 | 2.0 | 8.3 | 12.0 | 6.4 | 7.2 | ||
| Year | |||||||||||||||||||
| 2017 | 0.7 | 0.4 | 2.5 | 2.3 | 3.9 | 3.1 | 2.1 | 1.0 | 0.6 | 0.5 | 0.6 | 0.8 | 0.7 | 2.9 | 2.0 | 0.6 | 1.6 | ||
| 2016 | 0.8 | 0.4 | 2.5 | 5.0 | 3.7 | 3.1 | 3.0 | 1.1 | 1.4 | 1.3 | 1.5 | 1.1 | 0.7 | 3.8 | 2.3 | 1.4 | 2.2 | ||
| 2015 | 1.6 | 1.3 | 5.5 | 10.3 | 8.3 | 8.4 | 3.5 | 1.7 | 2.1 | 2.2 | 1.8 | 1.2 | 1.4 | 8.3 | 4.5 | 2.0 | 4.3 | ||
| 2014 | 0.0 | 0.4 | 9.4 | 6.6 | 12.2 | 13.8 | 7.1 | 1.4 | 3.4 | 2.0 | 1.8 | 0.8 | 0.5 | 8.6 | 6.8 | 2.6 | 5.2 | ||
| 2013 | 0.0 | 0.0 | 2.4 | 5.7 | 8.2 | 7.6 | 5.9 | 3.5 | 1.2 | 1.9 | 1.7 | 1.1 | 0.4 | 5.4 | 6.0 | 1.5 | 3.9 | ||
| 2012 | 0.0 | 0.4 | 2.4 | 3.0 | 5.2 | 6.2 | 2.0 | 3.9 | 1.2 | 1.1 | 1.6 | 0.3 | 0.2 | 3.4 | 3.7 | 1.2 | 2.4 | ||
| 2011 | 1.6 | 0.8 | 8.9 | 10.7 | 12.7 | 11.9 | 8.0 | 4.6 | 5.3 | 3.1 | 1.1 | 0.6 | 0.8 | 10.6 | 8.6 | 3.3 | 6.3 | ||
| 2010 | 0.0 | 0.0 | 6.4 | 4.8 | 12.9 | 6.2 | 6.3 | 4.7 | 4.3 | 4.3 | 1.0 | 3.4 | 1.9 | 7.0 | 6.0 | 3.7 | 5.1 | ||
| 2009 | 2.9 | 3.1 | 9.0 | 5.5 | 7.1 | 9.0 | 3.3 | 3.3 | 4.7 | 2.9 | 1.5 | 0.0 | 1.5 | 6.8 | 5.7 | 3.2 | 4.8 | ||
| 2008 | 0.7 | 0.9 | 8.2 | 6.4 | 8.7 | 9.9 | 9.5 | 7.4 | 2.2 | 3.1 | 1.8 | 3.3 | 1.9 | 7.2 | 9.2 | 2.6 | 5.5 | ||
| 2007 | 2.2 | 0.9 | 10.8 | 10.4 | 6.8 | 12.8 | 3.5 | 5.2 | 2.1 | 2.6 | 8.9 | 2.0 | 1.8 | 9.9 | 7.9 | 3.7 | 6.4 | ||
| 2006 | 2.6 | 1.9 | 15.0 | 13.0 | 11.9 | 16.8 | 9.0 | 3.7 | 3.2 | 2.2 | 0.0 | 2.3 | 2.3 | 13.4 | 10.4 | 2.3 | 7.4 | ||
| 2005 | 2.2 | 3.7 | 14.1 | 6.6 | 7.6 | 17.5 | 8.5 | 3.3 | 3.0 | 3.8 | 2.0 | 2.7 | 2.8 | 10.3 | 12.2 | 2.9 | 6.9 | ||
| 2004 | 1.2 | 0.7 | 6.7 | 6.4 | 8.7 | 9.7 | 3.0 | 5.1 | 5.2 | 4.4 | 2.9 | 1.8 | 1.2 | 7.2 | 6.4 | 4.4 | 4.8 | ||
| 2003 | 0.0 | 0.7 | 7.2 | 15.0 | 14.7 | 13.6 | 8.1 | 3.3 | 2.2 | 3.7 | 3.9 | 0.0 | 0.2 | 12.1 | 8.9 | 3.2 | 6.7 | ||
| 2002 | 0.0 | 0.8 | 9.0 | 4.3 | 8.0 | 8.0 | 10.1 | 3.9 | 2.7 | 4.8 | 9.4 | 3.2 | 1.5 | 6.9 | 7.5 | 4.7 | 5.5 | ||
| 2001 | 1.8 | 0.0 | 7.1 | 6.7 | 13.1 | 23.2 | 9.0 | 8.8 | 4.2 | 1.5 | 1.7 | 0.5 | 0.8 | 8.4 | 14.8 | 2.8 | 6.9 | ||
| 2000 | 0.8 | 3.9 | 14.4 | 12.3 | 13.9 | 15.4 | 14.9 | 9.5 | 6.9 | 4.9 | 0.0 | 1.1 | 1.9 | 13.5 | 13.6 | 4.8 | 9.3 | ||
| 1999 | 0.0 | 1.0 | 9.8 | 12.6 | 13.6 | 13.8 | 7.3 | 6.4 | 2.2 | 1.0 | 2.8 | 0.5 | 0.6 | 11.9 | 9.4 | 2.0 | 6.1 | ||
| 1998 | 0.0 | 1.9 | 2.4 | 5.4 | 9.7 | 10.4 | 5.9 | 5.7 | 2.2 | 0.0 | 0.0 | 0.0 | 0.6 | 5.8 | 7.9 | 1.3 | 4.6 | ||
| 1997 | 0.0 | 0.0 | 0.0 | 6.6 | 9.4 | 10.6 | 3.9 | 3.5 | 2.5 | 0.9 | 0.0 | 0.0 | 0.0 | 5.3 | 7.1 | 1.0 | 3.6 | ||
| 1996 | 0.0 | 0.0 | 5.3 | 8.8 | 7.4 | 10.1 | 3.9 | 2.4 | 3.9 | 1.6 | 0.0 | 1.1 | 0.4 | 7.4 | 5.6 | 2.2 | 4.2 | ||
| 1995 | 0.0 | 0.0 | 1.9 | 4.3 | 4.5 | 1.1 | 8.0 | 4.8 | 2.0 | 1.6 | 0.0 | 0.0 | 0.0 | 3.7 | 4.9 | 1.3 | 2.5 | ||
| 1994 | 2.0 | 1.3 | 0.0 | 2.3 | 3.7 | 8.7 | 10.3 | 6.9 | 1.1 | 0.0 | 0.0 | 0.0 | 0.9 | 2.4 | 8.7 | 0.3 | 2.6 | ||
| 1993 | 0.0 | 0.0 | 0.0 | 2.7 | 9.1 | 8.7 | 8.2 | 6.2 | 1.2 | 5.0 | 1.3 | 0.0 | 0.0 | 3.9 | 7.9 | 2.3 | 3.1 | ||
| 1992 | 3.1 | 1.9 | 2.4 | 5.3 | 15.3 | 7.9 | 0.0 | 4.9 | 1.4 | 1.7 | 2.6 | 0.0 | 1.7 | 7.2 | 4.3 | 1.9 | 4.0 | ||
| 1991 | 0.8 | 1.1 | 2.3 | 4.9 | 8.2 | 2.7 | 10.7 | 8.0 | 1.6 | 5.1 | 1.6 | 4.0 | 1.5 | 5.2 | 6.7 | 2.7 | 3.9 | ||
| 1990 | 2.6 | 1.1 | 5.4 | 8.2 | 15.9 | 20.8 | 8.3 | 8.5 | 10.2 | 1.2 | 1.4 | 7.9 | 2.9 | 10.1 | 12.6 | 4.5 | 6.8 | ||
| 1989 | 2.6 | 1.7 | 7.4 | 22.3 | 21.7 | 18.7 | 20.2 | 16.0 | 14.4 | 6.7 | 7.2 | 6.5 | 3.4 | 17.2 | 18.3 | 9.5 | 12.4 | ||
| 1988 | 0.0 | 0.7 | 2.8 | 5.1 | 10.0 | 10.8 | 11.6 | 12.6 | 13.9 | 4.8 | 4.5 | 3.4 | 1.3 | 6.5 | 11.6 | 7.8 | 6.5 | ||
| 1987 | 0.0 | 0.0 | 0.8 | 1.6 | 5.4 | 9.0 | 8.2 | 5.8 | 6.7 | 4.1 | 2.6 | 0.0 | 0.0 | 2.9 | 7.6 | 4.4 | 4.3 | ||
| 1986 | 0.0 | 0.0 | 3.8 | 5.6 | 40.4 | 32.4 | 56.5 | 33.3 | 35.5 | 5.9 | 3.4 | 0.0 | 0.0 | 16.9 | 38.7 | 13.5 | 16.9 | ||
| 1985 | 0.0 | 0.0 | 0.0 | 0.0 | 1.8 | 0.0 | 0.0 | 0.0 | 0.0 | 0.0 | 0.0 | 0.0 | 0.0 | 0.5 | 0.0 | 0.0 | 0.2 | ||
| 1984 | 0.0 | 0.0 | 0.0 | 0.0 | 0.0 | 0.0 | 0.0 | 0.0 | 0.0 | 0.0 | 3.2 | 0.0 | 0.0 | 0.0 | 0.0 | 1.1 | 0.4 | ||
| 1983 | 0.0 | 0.0 | 0.0 | 0.0 | 11.1 | 0.0 | 0.0 | 0.0 | 0.0 | - | 0.0 | 0.0 | 0.0 | 3.7 | 0.0 | 0.0 | 1.0 | ||
| 1982 | - | 0.0 | - | 0.0 | 0.0 | 0.0 | - | 0.0 | - | 0.0 | - | 0.0 | 0.0 | 0.0 | 0.0 | 0.0 | 0.0 | ||
Breeding data
Breeding records by month
Number of breeding records by breeding code and month, 2017 and all years| Breeding code | Jul | Aug | Sep | Oct | Nov | Dec | Jan | Feb | Mar | Apr | May | Jun |
|---|---|---|---|---|---|---|---|---|---|---|---|---|
| 2017 | ||||||||||||
| Breeding (BLA code) | 0 | 0 | 0 | 0 | 0 | 0 | 0 | 0 | 0 | 0 | 0 | 0 |
| Carrying Food | 0 | 0 | 0 | 0 | 0 | 0 | 0 | 0 | 0 | 0 | 0 | 0 |
| Copulating | 0 | 0 | 0 | 0 | 0 | 0 | 0 | 0 | 0 | 0 | 0 | 0 |
| Display | 0 | 0 | 0 | 0 | 0 | 0 | 0 | 0 | 0 | 0 | 0 | 0 |
| Dependent young | 0 | 0 | 0 | 0 | 0 | 0 | 0 | 0 | 0 | 0 | 0 | 0 |
| Faecal sac | 0 | 0 | 0 | 0 | 0 | 0 | 0 | 0 | 0 | 0 | 0 | 0 |
| Inspecting hollow | 0 | 0 | 0 | 0 | 0 | 0 | 0 | 0 | 0 | 0 | 0 | 0 |
| Nest building | 0 | 0 | 0 | 0 | 0 | 1 | 0 | 0 | 0 | 0 | 0 | 0 |
| Nest with eggs | 0 | 0 | 0 | 0 | 0 | 0 | 0 | 0 | 0 | 0 | 0 | 0 |
| Nest with young | 0 | 0 | 0 | 0 | 0 | 0 | 0 | 0 | 0 | 0 | 0 | 0 |
| On/leaving nest | 0 | 0 | 0 | 0 | 0 | 0 | 0 | 0 | 0 | 0 | 0 | 0 |
| All years | ||||||||||||
| Breeding (BLA code) | 0 | 0 | 0 | 1 | 2 | 1 | 1 | 1 | 0 | 0 | 0 | 0 |
| Carrying Food | 0 | 0 | 0 | 1 | 1 | 1 | 0 | 0 | 0 | 0 | 0 | 0 |
| Copulating | 0 | 0 | 1 | 0 | 0 | 0 | 0 | 0 | 0 | 0 | 0 | 0 |
| Display | 0 | 0 | 0 | 0 | 1 | 0 | 0 | 0 | 0 | 0 | 0 | 0 |
| Dependent young | 0 | 0 | 0 | 1 | 2 | 1 | 8 | 4 | 4 | 0 | 0 | 0 |
| Faecal sac | 0 | 0 | 0 | 0 | 0 | 0 | 0 | 0 | 0 | 0 | 0 | 0 |
| Inspecting hollow | 0 | 0 | 0 | 0 | 0 | 0 | 0 | 0 | 0 | 0 | 0 | 0 |
| Nest building | 0 | 0 | 1 | 7 | 5 | 6 | 0 | 0 | 0 | 0 | 0 | 0 |
| Nest with eggs | 0 | 0 | 0 | 0 | 1 | 2 | 0 | 0 | 0 | 0 | 0 | 0 |
| Nest with young | 0 | 0 | 0 | 1 | 4 | 1 | 2 | 0 | 0 | 0 | 0 | 0 |
| On/leaving nest | 0 | 0 | 0 | 3 | 6 | 0 | 1 | 0 | 0 | 0 | 0 | 0 |
Breeding records by year
Average number of breeding records per period by breeding code| Period | Breeding (BLA code) | Carrying Food | Copulating | Display | Dependent young | Faecal sac | Inspecting hollow | Nest building | Nest with eggs | Nest with young | On/leaving nest |
|---|---|---|---|---|---|---|---|---|---|---|---|
| All years | |||||||||||
| All | 0.2 | 0.1 | 0.0 | 0.0 | 0.6 | 0.0 | 0.0 | 0.5 | 0.1 | 0.2 | 0.3 |
| Previous years | |||||||||||
| All previous years | 0.2 | 0.1 | 0.0 | 0.0 | 0.6 | 0.0 | 0.0 | 0.5 | 0.1 | 0.2 | 0.3 |
| Previous 30 years | 0.2 | 0.1 | 0.0 | 0.0 | 0.7 | 0.0 | 0.0 | 0.6 | 0.1 | 0.2 | 0.3 |
| Previous 20 years | 0.3 | 0.1 | 0.0 | 0.0 | 0.5 | 0.0 | 0.0 | 0.6 | 0.0 | 0.2 | 0.5 |
| 10 year groups | |||||||||||
| [2007,2017) | 0.5 | 0.2 | 0.0 | 0.1 | 0.7 | 0.0 | 0.0 | 0.7 | 0.0 | 0.4 | 0.6 |
| [1997,2007) | 0.1 | 0.0 | 0.1 | 0.0 | 0.2 | 0.0 | 0.0 | 0.5 | 0.0 | 0.1 | 0.3 |
| [1987,1997) | 0.0 | 0.1 | 0.0 | 0.0 | 1.1 | 0.0 | 0.0 | 0.6 | 0.3 | 0.2 | 0.1 |
| 5 year groups | |||||||||||
| [2012,2017) | 0.6 | 0.4 | 0.0 | 0.2 | 0.8 | 0.0 | 0.0 | 0.6 | 0.0 | 0.8 | 1.2 |
| [2007,2012) | 0.4 | 0.0 | 0.0 | 0.0 | 0.6 | 0.0 | 0.0 | 0.8 | 0.0 | 0.0 | 0.0 |
| [2002,2007) | 0.0 | 0.0 | 0.2 | 0.0 | 0.0 | 0.0 | 0.0 | 0.8 | 0.0 | 0.2 | 0.2 |
| [1997,2002) | 0.2 | 0.0 | 0.0 | 0.0 | 0.4 | 0.0 | 0.0 | 0.2 | 0.0 | 0.0 | 0.4 |
| [1992,1997) | 0.0 | 0.0 | 0.0 | 0.0 | 0.2 | 0.0 | 0.0 | 0.0 | 0.0 | 0.0 | 0.2 |
| [1987,1992) | 0.0 | 0.2 | 0.0 | 0.0 | 2.0 | 0.0 | 0.0 | 1.2 | 0.6 | 0.4 | 0.0 |
| Year | |||||||||||
| 2017 | 0.0 | 0.0 | 0.0 | 0.0 | 0.0 | 0.0 | 0.0 | 1.0 | 0.0 | 0.0 | 0.0 |
| 2016 | 0.0 | 0.0 | 0.0 | 0.0 | 1.0 | 0.0 | 0.0 | 0.0 | 0.0 | 2.0 | 1.0 |
| 2015 | 1.0 | 0.0 | 0.0 | 0.0 | 1.0 | 0.0 | 0.0 | 1.0 | 0.0 | 2.0 | 4.0 |
| 2014 | 0.0 | 0.0 | 0.0 | 0.0 | 2.0 | 0.0 | 0.0 | 1.0 | 0.0 | 0.0 | 0.0 |
| 2013 | 1.0 | 2.0 | 0.0 | 1.0 | 0.0 | 0.0 | 0.0 | 0.0 | 0.0 | 0.0 | 1.0 |
| 2012 | 1.0 | 0.0 | 0.0 | 0.0 | 0.0 | 0.0 | 0.0 | 1.0 | 0.0 | 0.0 | 0.0 |
| 2011 | 1.0 | 0.0 | 0.0 | 0.0 | 3.0 | 0.0 | 0.0 | 0.0 | 0.0 | 0.0 | 0.0 |
| 2010 | 0.0 | 0.0 | 0.0 | 0.0 | 0.0 | 0.0 | 0.0 | 1.0 | 0.0 | 0.0 | 0.0 |
| 2009 | 0.0 | 0.0 | 0.0 | 0.0 | 0.0 | 0.0 | 0.0 | 1.0 | 0.0 | 0.0 | 0.0 |
| 2008 | 1.0 | 0.0 | 0.0 | 0.0 | 0.0 | 0.0 | 0.0 | 0.0 | 0.0 | 0.0 | 0.0 |
| 2007 | 0.0 | 0.0 | 0.0 | 0.0 | 0.0 | 0.0 | 0.0 | 2.0 | 0.0 | 0.0 | 0.0 |
| 2006 | 0.0 | 0.0 | 1.0 | 0.0 | 0.0 | 0.0 | 0.0 | 1.0 | 0.0 | 1.0 | 1.0 |
| 2005 | 0.0 | 0.0 | 0.0 | 0.0 | 0.0 | 0.0 | 0.0 | 2.0 | 0.0 | 0.0 | 0.0 |
| 2004 | 0.0 | 0.0 | 0.0 | 0.0 | 0.0 | 0.0 | 0.0 | 0.0 | 0.0 | 0.0 | 0.0 |
| 2003 | 0.0 | 0.0 | 0.0 | 0.0 | 0.0 | 0.0 | 0.0 | 0.0 | 0.0 | 0.0 | 0.0 |
| 2002 | 0.0 | 0.0 | 0.0 | 0.0 | 0.0 | 0.0 | 0.0 | 1.0 | 0.0 | 0.0 | 0.0 |
| 2001 | 0.0 | 0.0 | 0.0 | 0.0 | 1.0 | 0.0 | 0.0 | 0.0 | 0.0 | 0.0 | 0.0 |
| 2000 | 0.0 | 0.0 | 0.0 | 0.0 | 1.0 | 0.0 | 0.0 | 1.0 | 0.0 | 0.0 | 1.0 |
| 1999 | 1.0 | 0.0 | 0.0 | 0.0 | 0.0 | 0.0 | 0.0 | 0.0 | 0.0 | 0.0 | 1.0 |
| 1998 | 0.0 | 0.0 | 0.0 | 0.0 | 0.0 | 0.0 | 0.0 | 0.0 | 0.0 | 0.0 | 0.0 |
| 1997 | 0.0 | 0.0 | 0.0 | 0.0 | 0.0 | 0.0 | 0.0 | 0.0 | 0.0 | 0.0 | 0.0 |
| 1996 | 0.0 | 0.0 | 0.0 | 0.0 | 0.0 | 0.0 | 0.0 | 0.0 | 0.0 | 0.0 | 0.0 |
| 1995 | 0.0 | 0.0 | 0.0 | 0.0 | 1.0 | 0.0 | 0.0 | 0.0 | 0.0 | 0.0 | 1.0 |
| 1994 | 0.0 | 0.0 | 0.0 | 0.0 | 0.0 | 0.0 | 0.0 | 0.0 | 0.0 | 0.0 | 0.0 |
| 1993 | 0.0 | 0.0 | 0.0 | 0.0 | 0.0 | 0.0 | 0.0 | 0.0 | 0.0 | 0.0 | 0.0 |
| 1992 | 0.0 | 0.0 | 0.0 | 0.0 | 0.0 | 0.0 | 0.0 | 0.0 | 0.0 | 0.0 | 0.0 |
| 1991 | 0.0 | 0.0 | 0.0 | 0.0 | 0.0 | 0.0 | 0.0 | 0.0 | 0.0 | 0.0 | 0.0 |
| 1990 | 0.0 | 0.0 | 0.0 | 0.0 | 1.0 | 0.0 | 0.0 | 0.0 | 1.0 | 0.0 | 0.0 |
| 1989 | 0.0 | 1.0 | 0.0 | 0.0 | 3.0 | 0.0 | 0.0 | 5.0 | 1.0 | 1.0 | 0.0 |
| 1988 | 0.0 | 0.0 | 0.0 | 0.0 | 4.0 | 0.0 | 0.0 | 1.0 | 0.0 | 0.0 | 0.0 |
| 1987 | 0.0 | 0.0 | 0.0 | 0.0 | 2.0 | 0.0 | 0.0 | 0.0 | 1.0 | 1.0 | 0.0 |
| 1986 | 0.0 | 0.0 | 0.0 | 0.0 | 0.0 | 0.0 | 0.0 | 0.0 | 0.0 | 1.0 | 0.0 |
| 1985 | 0.0 | 0.0 | 0.0 | 0.0 | 0.0 | 0.0 | 0.0 | 0.0 | 0.0 | 0.0 | 0.0 |
| 1984 | 0.0 | 0.0 | 0.0 | 0.0 | 0.0 | 0.0 | 0.0 | 0.0 | 0.0 | 0.0 | 0.0 |
| 1983 | 0.0 | 0.0 | 0.0 | 0.0 | 0.0 | 0.0 | 0.0 | 0.0 | 0.0 | 0.0 | 0.0 |
| 1982 | 0.0 | 0.0 | 0.0 | 0.0 | 0.0 | 0.0 | 0.0 | 0.0 | 0.0 | 0.0 | 0.0 |
Distribution map
Distribution - 2017
This map shows the observed distribution of the Mistletoebird for 2017.
The red circles are the grid cells where Mistletoebird have been reported.
The transparency of the red circles indicate how many surveys sheets were submitted for that grid cell; the darker the red the more reliable the data. Of the 315 grid cells with reports, 83 had only one sheet; an example is grid number V20.
The size of the circle represents the reporting rate. The maximum reporting rate for Mistletoebird was 100.0% (eg grid number V20) and the minimum was 0.2% (eg grid number J14). 
Distribution - all years
This map shows the observed distribution of the Mistletoebird for all years.
The red circles are the grid cells where Mistletoebird have been reported.
The transparency of the red circles indicate how many surveys sheets were submitted for that grid cell; the darker the red the more reliable the data. Of the 703 grid cells with reports, 55 had only one sheet; an example is grid number A12.
The size of the circle represents the reporting rate. The maximum reporting rate for Mistletoebird was 71.4% (eg grid number O4) and the minimum was 0.2% (eg grid number K11). 
Breeding map
Breeding - 2017
This map shows the breeding distribution of the Mistletoebird for 2017.
The red circles are the grid cells where breeding activity for Mistletoebird have been reported.
The size of the circle represents the number of reports. 
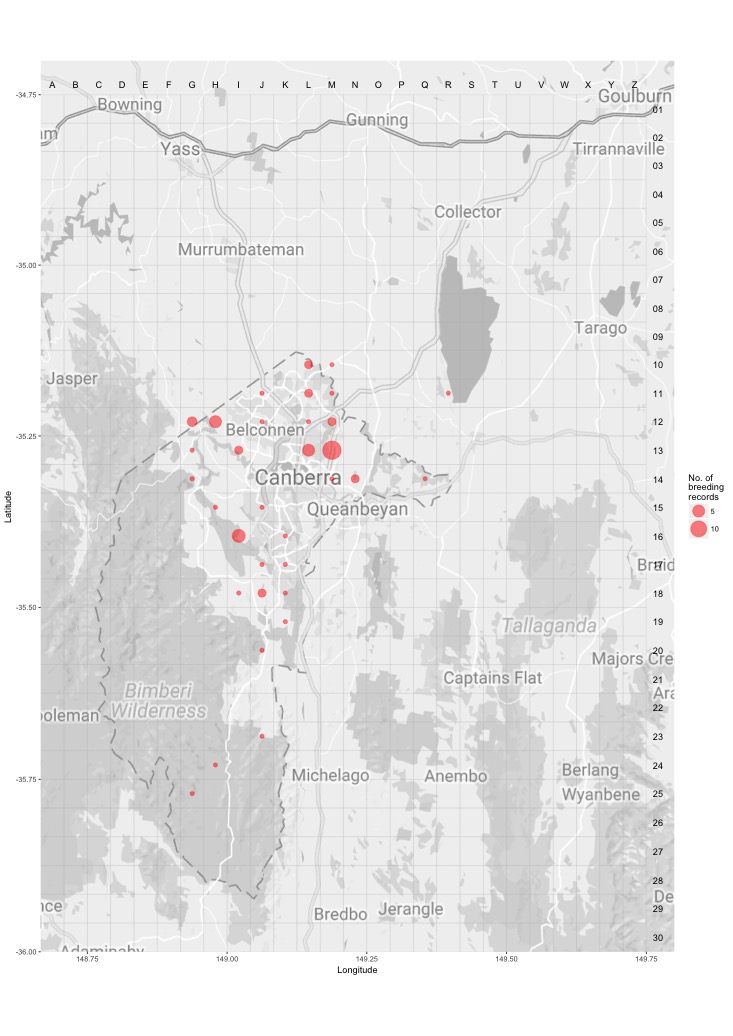
Breeding - all years
This map shows the breeding distribution of the Mistletoebird for all years.
The red circles are the grid cells where breeding activity for Mistletoebird have been reported.
The size of the circle represents the number of reports.