Magpie-lark
Grallina cyanoleuca
ABR description
The following is extracted from the Annual Bird Report for the twelve months to June 2017.
Very common, breeding resident
Our largest and most visible flycatcher.
General: Reporting rate 47.5% is up 5% on last year and up 26% on the 10YA and 30% on the 30YA. It is at its highest level ever. Abundance 1.7046 is like last year, but up 26% on the 10YA and 58% on the 30YA. Recorded throughout the year: spring 25%, summer 28% and autumn 28% and slightly lower in winter 19%. Max 127/25 Jun FSP (SmA1), average 3.6 and median 2. Earliest breeding nb/27 Aug Fadden Hills Ponds (Gr K16 (CaR3) and latest dy/3 Mar LJerr GrM16 (HeS1).
GBS: 1,958 records, down 12% on last year. Abundance (A=2.0140) is up 5% on last year, 3% on the 10YA but down 2% on the 30YA. Recorded in all weeks evenly throughout the year. Max 16/2wk Feb Curtin (AjR1), average 2.6 and median 2. Earliest breeding nb/3 wk Aug Weston (MaA2) and latest dy/3wk May Aranda (HaK1).

Abundance
Abundance is the average number of birds of that species per survey. Where the species was observed (presence recorded) but the number of birds seen was not recorded, this is treated as a count of zero.
Abundance by year
This chart shows the abundance of Magpie-lark between 1982 and 2017. 
Abundance by month
This chart shows the monthly abundance of Magpie-lark. The blue lines show the abundance for the twelve months to June 2017 and the bars show the average abundance for the period 1982 to 2017. 
Abundance by season
This chart shows the seasonal abundance of Magpie-lark. The blue lines show the seasonal abundance for the twelve months to June 2017 and the bars show the average seasonal abundance for the period 1982 to 2017. 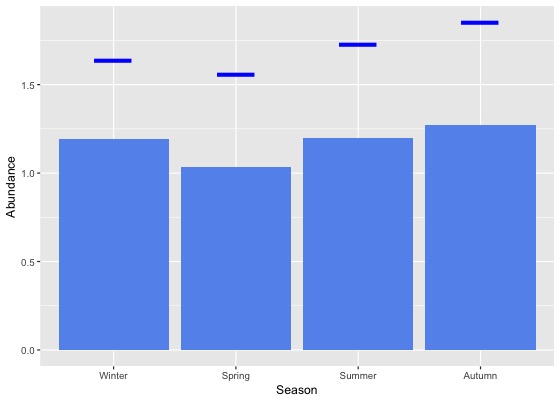
Abundance data
| Month | Season | ||||||||||||||||||
|---|---|---|---|---|---|---|---|---|---|---|---|---|---|---|---|---|---|---|---|
| Period | Jul | Aug | Sep | Oct | Nov | Dec | Jan | Feb | Mar | Apr | May | Jun | Winter | Spring | Summer | Autumn | All | ||
| All years | |||||||||||||||||||
| All | 1.2 | 1.3 | 1.0 | 1.1 | 1.0 | 0.9 | 1.3 | 1.5 | 1.3 | 1.3 | 1.3 | 1.1 | 1.2 | 1.0 | 1.2 | 1.3 | 1.2 | ||
| Previous years | |||||||||||||||||||
| All previous years | 1.1 | 1.3 | 0.9 | 1.0 | 0.9 | 0.8 | 1.2 | 1.4 | 1.2 | 1.1 | 1.2 | 1.0 | 1.1 | 1.0 | 1.1 | 1.2 | 1.1 | ||
| Previous 30 years | 1.1 | 1.3 | 0.9 | 1.0 | 0.9 | 0.8 | 1.2 | 1.4 | 1.2 | 1.1 | 1.2 | 1.0 | 1.1 | 1.0 | 1.1 | 1.2 | 1.1 | ||
| Previous 20 years | 1.3 | 1.5 | 1.0 | 1.1 | 1.0 | 0.8 | 1.2 | 1.5 | 1.2 | 1.1 | 1.3 | 1.0 | 1.2 | 1.0 | 1.2 | 1.2 | 1.1 | ||
| 10 year groups | |||||||||||||||||||
| [2007,2017) | 1.6 | 1.8 | 1.2 | 1.2 | 1.2 | 1.0 | 1.4 | 1.7 | 1.4 | 1.3 | 1.5 | 1.2 | 1.5 | 1.2 | 1.3 | 1.4 | 1.3 | ||
| [1997,2007) | 0.6 | 0.7 | 0.5 | 0.6 | 0.5 | 0.4 | 0.8 | 0.9 | 0.8 | 0.6 | 0.8 | 0.6 | 0.6 | 0.5 | 0.7 | 0.8 | 0.6 | ||
| [1987,1997) | 0.7 | 0.8 | 0.6 | 0.8 | 0.6 | 0.7 | 0.7 | 0.9 | 0.8 | 1.1 | 0.9 | 0.9 | 0.8 | 0.7 | 0.8 | 0.9 | 0.8 | ||
| 5 year groups | |||||||||||||||||||
| [2012,2017) | 1.9 | 2.1 | 1.4 | 1.3 | 1.4 | 1.2 | 1.4 | 1.8 | 1.7 | 1.6 | 1.7 | 1.4 | 1.8 | 1.4 | 1.5 | 1.6 | 1.5 | ||
| [2007,2012) | 0.9 | 1.0 | 0.9 | 1.0 | 0.8 | 0.6 | 1.1 | 1.1 | 0.8 | 0.8 | 0.8 | 0.7 | 0.8 | 0.9 | 0.9 | 0.8 | 0.9 | ||
| [2002,2007) | 0.6 | 0.6 | 0.4 | 0.6 | 0.5 | 0.4 | 0.7 | 1.0 | 0.9 | 0.7 | 0.9 | 0.6 | 0.6 | 0.5 | 0.7 | 0.8 | 0.6 | ||
| [1997,2002) | 0.6 | 0.8 | 0.6 | 0.6 | 0.6 | 0.5 | 0.9 | 0.8 | 0.7 | 0.5 | 0.8 | 0.7 | 0.7 | 0.6 | 0.7 | 0.6 | 0.7 | ||
| [1992,1997) | 1.2 | 0.7 | 0.7 | 0.8 | 0.8 | 0.9 | 1.1 | 0.8 | 0.8 | 1.1 | 1.2 | 0.9 | 0.9 | 0.8 | 0.9 | 1.0 | 0.9 | ||
| [1987,1992) | 0.5 | 0.8 | 0.6 | 0.7 | 0.5 | 0.7 | 0.6 | 1.0 | 0.8 | 1.1 | 0.8 | 0.9 | 0.7 | 0.6 | 0.7 | 0.9 | 0.7 | ||
| Year | |||||||||||||||||||
| 2017 | 1.9 | 1.5 | 1.5 | 1.6 | 1.5 | 1.5 | 1.8 | 1.9 | 2.0 | 1.9 | 1.6 | 1.6 | 1.6 | 1.6 | 1.7 | 1.9 | 1.7 | ||
| 2016 | 2.0 | 2.1 | 1.6 | 1.6 | 2.0 | 1.5 | 1.7 | 1.8 | 1.7 | 1.6 | 1.6 | 1.5 | 1.9 | 1.7 | 1.7 | 1.6 | 1.7 | ||
| 2015 | 2.4 | 3.4 | 2.3 | 1.7 | 1.5 | 1.7 | 1.7 | 2.1 | 1.5 | 1.7 | 1.9 | 1.9 | 2.5 | 1.9 | 1.8 | 1.7 | 1.9 | ||
| 2014 | 2.0 | 2.0 | 0.8 | 1.4 | 1.2 | 1.2 | 1.6 | 2.6 | 3.1 | 2.1 | 2.1 | 1.2 | 1.6 | 1.2 | 1.8 | 2.5 | 1.8 | ||
| 2013 | 1.5 | 0.9 | 0.6 | 0.8 | 0.8 | 0.7 | 1.1 | 1.1 | 1.4 | 1.4 | 1.6 | 0.9 | 1.1 | 0.8 | 0.9 | 1.4 | 1.0 | ||
| 2012 | 0.9 | 0.6 | 0.4 | 0.7 | 0.5 | 0.5 | 0.7 | 0.5 | 0.6 | 0.8 | 0.9 | 0.7 | 0.8 | 0.6 | 0.6 | 0.8 | 0.7 | ||
| 2011 | 2.4 | 2.5 | 1.6 | 1.4 | 0.9 | 0.7 | 1.1 | 0.7 | 0.6 | 0.6 | 0.7 | 0.8 | 1.5 | 1.4 | 0.8 | 0.6 | 1.0 | ||
| 2010 | 0.6 | 0.5 | 0.7 | 1.0 | 0.7 | 0.8 | 1.0 | 1.7 | 1.0 | 0.6 | 1.5 | 1.4 | 1.0 | 0.8 | 1.0 | 0.9 | 0.9 | ||
| 2009 | 0.6 | 1.1 | 0.8 | 0.9 | 0.7 | 0.4 | 1.2 | 1.5 | 0.6 | 0.7 | 0.6 | 0.5 | 0.6 | 0.8 | 1.0 | 0.7 | 0.8 | ||
| 2008 | 0.3 | 0.5 | 0.9 | 1.0 | 1.2 | 0.6 | 1.7 | 1.0 | 0.7 | 1.0 | 0.8 | 0.4 | 0.4 | 1.0 | 1.0 | 0.9 | 0.9 | ||
| 2007 | 0.8 | 0.2 | 0.4 | 0.9 | 0.8 | 0.5 | 0.8 | 1.2 | 0.9 | 1.1 | 0.9 | 0.4 | 0.4 | 0.7 | 0.7 | 1.0 | 0.7 | ||
| 2006 | 0.6 | 0.8 | 0.5 | 1.0 | 0.6 | 0.4 | 1.2 | 1.1 | 1.6 | 0.6 | 0.8 | 0.8 | 0.7 | 0.8 | 0.9 | 1.2 | 0.9 | ||
| 2005 | 0.6 | 0.3 | 0.3 | 0.4 | 0.6 | 0.5 | 0.5 | 0.7 | 0.6 | 1.0 | 1.3 | 0.7 | 0.6 | 0.4 | 0.5 | 1.0 | 0.6 | ||
| 2004 | 0.4 | 0.3 | 0.4 | 0.3 | 0.3 | 0.2 | 0.4 | 1.0 | 0.8 | 0.5 | 1.2 | 0.2 | 0.3 | 0.3 | 0.5 | 0.7 | 0.5 | ||
| 2003 | 0.8 | 0.7 | 0.3 | 0.4 | 0.6 | 0.4 | 0.6 | 1.7 | 0.5 | 0.9 | 0.2 | 0.2 | 0.5 | 0.4 | 0.9 | 0.6 | 0.6 | ||
| 2002 | 0.4 | 0.8 | 0.6 | 0.4 | 0.3 | 0.5 | 0.7 | 0.4 | 0.7 | 0.5 | 0.7 | 0.6 | 0.6 | 0.4 | 0.5 | 0.6 | 0.5 | ||
| 2001 | 0.5 | 0.5 | 0.5 | 0.6 | 0.7 | 0.4 | 0.9 | 0.5 | 0.5 | 0.5 | 0.6 | 0.4 | 0.5 | 0.6 | 0.6 | 0.5 | 0.5 | ||
| 2000 | 0.8 | 1.5 | 0.7 | 0.8 | 0.8 | 0.5 | 0.8 | 0.8 | 0.7 | 0.5 | 0.7 | 0.6 | 1.0 | 0.8 | 0.7 | 0.6 | 0.8 | ||
| 1999 | 0.3 | 0.7 | 0.6 | 0.7 | 0.5 | 0.7 | 1.0 | 0.8 | 0.8 | 0.4 | 1.1 | 0.9 | 0.7 | 0.6 | 0.8 | 0.8 | 0.7 | ||
| 1998 | 1.8 | 0.1 | 0.5 | 0.4 | 0.3 | 0.3 | 1.1 | 0.8 | 0.3 | 0.7 | 0.4 | 1.3 | 1.0 | 0.4 | 0.7 | 0.4 | 0.6 | ||
| 1997 | 0.3 | 0.5 | 0.3 | 0.4 | 0.3 | 0.3 | 0.9 | 2.0 | 2.0 | 0.7 | 0.6 | 0.2 | 0.3 | 0.3 | 0.9 | 1.0 | 0.6 | ||
| 1996 | 0.6 | 0.3 | 0.5 | 0.6 | 0.4 | 0.7 | 1.2 | 0.6 | 0.3 | 0.7 | 1.1 | 1.6 | 0.8 | 0.5 | 0.9 | 0.6 | 0.7 | ||
| 1995 | 1.0 | 0.6 | 0.2 | 0.7 | 0.2 | 0.4 | 1.1 | 0.3 | 1.0 | 1.1 | 0.9 | 0.4 | 0.6 | 0.4 | 0.7 | 1.0 | 0.7 | ||
| 1994 | 2.5 | 1.4 | 1.0 | 1.0 | 0.9 | 0.8 | 0.9 | 1.2 | 0.5 | 0.7 | 0.9 | 0.6 | 1.3 | 1.0 | 1.0 | 0.7 | 1.0 | ||
| 1993 | 0.8 | 1.1 | 0.7 | 1.2 | 1.8 | 1.7 | 0.8 | 1.3 | 1.2 | 1.8 | 1.7 | 1.0 | 1.0 | 1.3 | 1.3 | 1.6 | 1.3 | ||
| 1992 | 1.6 | 0.4 | 1.2 | 1.0 | 0.9 | 1.2 | 1.2 | 1.1 | 1.1 | 1.7 | 1.3 | 0.8 | 1.0 | 1.0 | 1.2 | 1.4 | 1.1 | ||
| 1991 | 0.8 | 0.8 | 1.2 | 0.9 | 1.2 | 0.8 | 1.9 | 2.1 | 1.6 | 3.1 | 2.2 | 1.1 | 0.8 | 1.1 | 1.5 | 2.3 | 1.3 | ||
| 1990 | 0.4 | 0.5 | 0.4 | 0.6 | 0.4 | 0.8 | 0.5 | 0.7 | 2.1 | 2.1 | 1.7 | 1.5 | 0.6 | 0.4 | 0.7 | 2.0 | 0.9 | ||
| 1989 | 0.5 | 0.7 | 0.5 | 0.8 | 0.5 | 0.6 | 0.4 | 1.3 | 0.5 | 0.9 | 0.6 | 1.2 | 0.8 | 0.6 | 0.8 | 0.7 | 0.7 | ||
| 1988 | 0.4 | 1.0 | 0.6 | 0.6 | 0.4 | 0.6 | 0.4 | 0.7 | 0.4 | 0.7 | 0.4 | 0.6 | 0.7 | 0.5 | 0.6 | 0.5 | 0.6 | ||
| 1987 | 1.1 | 1.7 | 0.5 | 0.7 | 0.4 | 0.7 | 0.6 | 0.8 | 0.5 | 0.6 | 0.5 | 0.6 | 0.7 | 0.5 | 0.7 | 0.5 | 0.6 | ||
| 1986 | 0.2 | 2.1 | 0.5 | 2.2 | 0.4 | 2.7 | 0.7 | 2.1 | 1.1 | 2.6 | 0.6 | 2.0 | 1.5 | 0.9 | 2.0 | 1.6 | 1.5 | ||
| 1985 | 0.5 | 2.3 | 0.3 | 1.1 | 0.5 | 1.4 | 1.1 | 6.4 | 1.4 | 3.2 | 0.9 | 2.7 | 1.8 | 0.7 | 2.4 | 2.1 | 1.4 | ||
| 1984 | 0.0 | 0.0 | 0.0 | 0.0 | 0.0 | 0.2 | 0.8 | 0.5 | 0.3 | 0.2 | 0.4 | 0.1 | 0.1 | 0.0 | 0.6 | 0.3 | 0.3 | ||
| 1983 | 0.0 | 0.0 | 0.0 | 0.2 | 0.3 | 0.2 | 0.0 | 0.0 | 0.0 | - | 0.0 | 0.0 | 0.0 | 0.2 | 0.1 | 0.0 | 0.1 | ||
| 1982 | - | 0.0 | - | 0.0 | 0.0 | 0.0 | - | 0.0 | - | 0.0 | - | 0.0 | 0.0 | 0.0 | 0.0 | 0.0 | 0.0 | ||
Reporting rates
Reporting rate is the proportion of all surveys in which the species was present.
Reporting rate by year
This chart shows the reporting rate of Magpie-lark each year between 1982 and 2017. 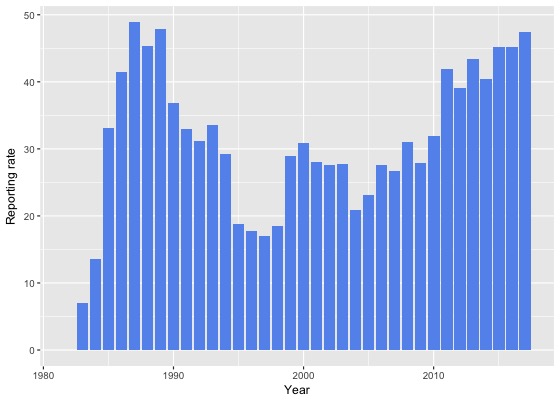
Reporting rate by month
This chart shows the reporting rate by month of Magpie-lark. The blue lines show the reporting rate for the twelve months to June 2017 and the bars show the average reporting rate for the period 1982 to 2017. 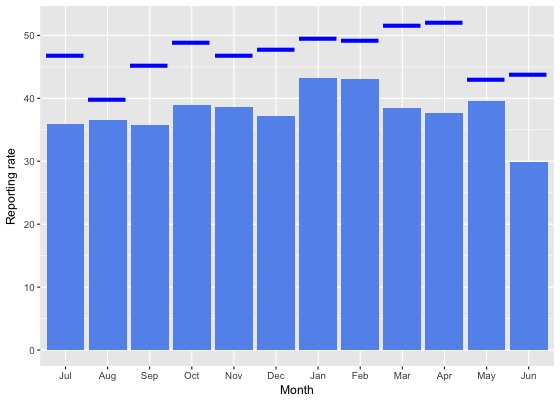
Reporting rate by season
This chart shows the seasonal reporting rate of Magpie-lark. The blue lines show the seasonal reporting rate for the twelve months to June 2017 and the bars show the average seasonal reporting rate for the period 1982 to 2017. 
Reporting rate data
| Month | Season | ||||||||||||||||||
|---|---|---|---|---|---|---|---|---|---|---|---|---|---|---|---|---|---|---|---|
| Period | Jul | Aug | Sep | Oct | Nov | Dec | Jan | Feb | Mar | Apr | May | Jun | Winter | Spring | Summer | Autumn | All | ||
| All years | |||||||||||||||||||
| All | 35.9 | 36.5 | 35.7 | 38.9 | 38.6 | 37.2 | 43.2 | 43.0 | 38.4 | 37.6 | 39.6 | 29.8 | 33.6 | 37.8 | 41.1 | 38.4 | 38.0 | ||
| Previous years | |||||||||||||||||||
| All previous years | 34.2 | 35.9 | 34.4 | 37.5 | 37.3 | 35.7 | 42.0 | 41.7 | 36.1 | 35.3 | 38.8 | 27.1 | 31.8 | 36.5 | 39.6 | 36.5 | 36.3 | ||
| Previous 30 years | 34.4 | 36.1 | 34.6 | 37.6 | 37.5 | 35.8 | 42.1 | 41.7 | 36.1 | 35.3 | 39.0 | 27.2 | 31.9 | 36.6 | 39.7 | 36.5 | 36.5 | ||
| Previous 20 years | 33.9 | 36.7 | 33.4 | 37.1 | 37.7 | 34.9 | 43.1 | 42.1 | 35.7 | 34.6 | 38.9 | 25.9 | 31.2 | 36.1 | 39.9 | 36.1 | 36.1 | ||
| 10 year groups | |||||||||||||||||||
| [2007,2017) | 40.4 | 40.6 | 37.8 | 39.7 | 42.8 | 40.4 | 46.7 | 45.9 | 40.3 | 37.6 | 43.4 | 29.7 | 35.8 | 39.9 | 44.4 | 40.0 | 40.4 | ||
| [1997,2007) | 22.7 | 27.9 | 24.7 | 28.2 | 27.4 | 24.4 | 31.1 | 32.3 | 25.8 | 26.6 | 28.1 | 17.7 | 22.0 | 26.7 | 28.5 | 26.6 | 26.1 | ||
| [1987,1997) | 36.1 | 34.3 | 40.5 | 40.6 | 36.8 | 41.0 | 36.2 | 39.9 | 38.3 | 38.9 | 39.1 | 34.0 | 34.7 | 39.2 | 39.0 | 38.8 | 38.0 | ||
| 5 year groups | |||||||||||||||||||
| [2012,2017) | 44.6 | 44.4 | 40.8 | 42.8 | 46.6 | 43.8 | 47.6 | 47.4 | 42.5 | 41.6 | 45.9 | 34.0 | 40.3 | 43.2 | 46.4 | 43.0 | 43.5 | ||
| [2007,2012) | 28.3 | 27.2 | 30.8 | 34.5 | 32.5 | 33.2 | 43.3 | 39.4 | 34.5 | 28.4 | 36.4 | 21.8 | 24.6 | 33.1 | 38.1 | 32.4 | 32.5 | ||
| [2002,2007) | 24.2 | 27.0 | 23.2 | 27.9 | 25.8 | 23.7 | 31.9 | 35.0 | 25.3 | 26.4 | 26.1 | 15.4 | 21.2 | 25.7 | 28.9 | 25.9 | 25.5 | ||
| [1997,2002) | 20.4 | 29.0 | 26.5 | 28.5 | 29.3 | 25.3 | 30.2 | 29.5 | 26.5 | 26.9 | 30.7 | 20.8 | 23.1 | 28.0 | 28.0 | 27.6 | 26.9 | ||
| [1992,1997) | 28.3 | 19.2 | 25.2 | 25.7 | 32.1 | 28.2 | 23.8 | 22.9 | 22.5 | 24.4 | 28.8 | 18.3 | 21.5 | 27.8 | 25.0 | 25.0 | 25.0 | ||
| [1987,1992) | 39.7 | 42.4 | 47.7 | 48.7 | 39.0 | 46.5 | 43.1 | 46.4 | 47.7 | 47.1 | 44.5 | 42.8 | 41.7 | 44.9 | 45.4 | 46.5 | 44.6 | ||
| Year | |||||||||||||||||||
| 2017 | 46.9 | 39.9 | 45.3 | 48.9 | 46.8 | 47.8 | 49.6 | 49.2 | 51.6 | 52.1 | 43.0 | 43.8 | 43.4 | 47.2 | 48.9 | 49.0 | 47.5 | ||
| 2016 | 45.5 | 42.8 | 40.3 | 46.4 | 54.8 | 44.6 | 46.1 | 44.6 | 46.8 | 44.0 | 47.1 | 38.5 | 42.1 | 46.6 | 45.2 | 45.9 | 45.2 | ||
| 2015 | 42.4 | 50.6 | 48.5 | 44.8 | 43.6 | 44.8 | 45.6 | 50.5 | 41.5 | 43.1 | 50.9 | 39.0 | 43.1 | 45.6 | 46.9 | 44.6 | 45.2 | ||
| 2014 | 43.6 | 40.8 | 33.8 | 45.2 | 37.8 | 37.8 | 50.0 | 42.8 | 38.4 | 37.3 | 37.1 | 30.0 | 36.1 | 40.2 | 45.4 | 37.8 | 40.5 | ||
| 2013 | 38.2 | 38.9 | 42.1 | 32.5 | 43.8 | 46.6 | 56.0 | 58.1 | 44.8 | 46.3 | 43.1 | 22.4 | 32.3 | 38.4 | 52.7 | 45.0 | 43.4 | ||
| 2012 | 52.6 | 46.9 | 34.0 | 40.6 | 43.4 | 40.2 | 43.2 | 43.4 | 31.8 | 29.8 | 41.2 | 27.4 | 40.9 | 39.5 | 42.2 | 33.0 | 39.1 | ||
| 2011 | 43.1 | 33.6 | 36.8 | 38.2 | 30.9 | 49.7 | 60.9 | 53.4 | 43.4 | 32.0 | 44.7 | 30.8 | 34.0 | 36.5 | 54.9 | 39.8 | 41.9 | ||
| 2010 | 31.2 | 22.8 | 33.0 | 36.6 | 27.3 | 30.5 | 45.4 | 38.8 | 34.3 | 24.3 | 31.4 | 24.0 | 25.2 | 33.5 | 37.2 | 29.8 | 32.0 | ||
| 2009 | 26.6 | 39.6 | 28.2 | 30.9 | 29.5 | 19.6 | 31.3 | 30.8 | 31.6 | 25.0 | 25.2 | 18.5 | 25.4 | 29.9 | 26.4 | 27.5 | 27.9 | ||
| 2008 | 18.6 | 24.3 | 31.8 | 36.4 | 38.9 | 34.7 | 40.5 | 30.6 | 30.6 | 28.3 | 31.5 | 17.3 | 19.4 | 35.6 | 35.3 | 29.6 | 31.1 | ||
| 2007 | 23.1 | 16.7 | 23.7 | 29.6 | 39.9 | 24.5 | 26.4 | 30.4 | 28.5 | 31.2 | 38.2 | 15.3 | 17.0 | 29.7 | 26.2 | 31.6 | 26.8 | ||
| 2006 | 25.0 | 29.1 | 26.9 | 33.2 | 29.2 | 19.0 | 41.6 | 38.5 | 28.2 | 22.0 | 24.6 | 15.3 | 20.9 | 30.5 | 32.5 | 25.7 | 27.6 | ||
| 2005 | 16.2 | 17.8 | 17.1 | 18.2 | 31.7 | 24.3 | 25.5 | 30.4 | 24.7 | 30.6 | 32.3 | 15.3 | 16.0 | 21.0 | 25.8 | 28.9 | 23.1 | ||
| 2004 | 25.4 | 24.3 | 22.6 | 25.6 | 20.3 | 17.5 | 25.5 | 21.2 | 16.6 | 18.7 | 21.4 | 10.4 | 20.8 | 22.8 | 21.0 | 18.4 | 20.8 | ||
| 2003 | 25.6 | 29.5 | 22.0 | 28.0 | 26.6 | 22.9 | 27.4 | 54.9 | 22.9 | 36.4 | 19.4 | 16.1 | 23.3 | 25.3 | 34.5 | 27.2 | 27.8 | ||
| 2002 | 26.9 | 33.9 | 29.4 | 28.3 | 22.5 | 30.4 | 37.1 | 19.7 | 31.8 | 22.0 | 29.4 | 19.4 | 25.7 | 26.8 | 29.5 | 27.9 | 27.6 | ||
| 2001 | 18.7 | 28.9 | 29.1 | 31.9 | 35.2 | 32.2 | 27.5 | 29.9 | 28.3 | 30.2 | 25.4 | 18.2 | 21.4 | 31.4 | 30.1 | 28.2 | 28.1 | ||
| 2000 | 30.2 | 43.8 | 29.8 | 34.4 | 35.6 | 24.1 | 31.8 | 29.5 | 29.8 | 30.5 | 30.9 | 24.7 | 32.5 | 33.3 | 28.1 | 30.3 | 30.8 | ||
| 1999 | 23.5 | 21.6 | 28.2 | 25.8 | 31.8 | 31.2 | 33.6 | 31.4 | 25.4 | 25.8 | 38.1 | 26.6 | 24.9 | 28.5 | 32.0 | 29.5 | 29.0 | ||
| 1998 | 16.2 | 15.1 | 21.1 | 16.3 | 20.4 | 14.2 | 27.9 | 24.5 | 12.9 | 23.1 | 25.9 | 13.3 | 14.5 | 19.5 | 20.7 | 17.6 | 18.5 | ||
| 1997 | 11.5 | 15.5 | 15.5 | 21.1 | 13.7 | 12.5 | 27.5 | 28.1 | 27.5 | 16.5 | 24.4 | 8.3 | 11.5 | 16.2 | 20.3 | 20.6 | 17.0 | ||
| 1996 | 16.4 | 10.6 | 20.0 | 15.8 | 15.7 | 25.3 | 14.6 | 16.5 | 12.7 | 21.9 | 29.3 | 20.7 | 15.7 | 16.8 | 18.8 | 19.6 | 17.7 | ||
| 1995 | 23.7 | 13.2 | 9.7 | 19.5 | 13.6 | 20.7 | 28.3 | 15.9 | 22.4 | 19.4 | 24.7 | 14.9 | 16.8 | 15.1 | 22.8 | 21.7 | 18.7 | ||
| 1994 | 39.2 | 31.2 | 45.6 | 32.6 | 44.9 | 26.1 | 25.0 | 25.9 | 18.2 | 22.1 | 18.8 | 20.2 | 28.6 | 41.4 | 25.6 | 20.1 | 29.2 | ||
| 1993 | 36.7 | 30.8 | 25.8 | 41.3 | 57.6 | 50.0 | 20.4 | 34.4 | 30.9 | 28.3 | 32.5 | 17.4 | 27.6 | 41.9 | 34.6 | 30.7 | 33.6 | ||
| 1992 | 32.3 | 14.8 | 31.8 | 29.8 | 37.5 | 28.6 | 32.8 | 34.1 | 32.4 | 39.0 | 39.5 | 18.3 | 22.3 | 32.7 | 31.5 | 36.9 | 31.2 | ||
| 1991 | 23.6 | 18.1 | 27.9 | 35.9 | 36.1 | 25.7 | 37.5 | 50.0 | 36.5 | 49.2 | 37.7 | 40.0 | 24.7 | 33.6 | 36.1 | 41.0 | 32.9 | ||
| 1990 | 38.7 | 39.5 | 28.0 | 33.7 | 29.0 | 45.8 | 36.1 | 38.0 | 47.7 | 35.7 | 38.4 | 31.6 | 37.7 | 30.2 | 40.0 | 40.8 | 36.9 | ||
| 1989 | 45.9 | 48.7 | 51.1 | 56.5 | 46.5 | 44.8 | 41.5 | 43.3 | 49.4 | 49.2 | 44.1 | 48.8 | 47.8 | 51.8 | 43.3 | 47.8 | 47.8 | ||
| 1988 | 43.1 | 47.0 | 61.8 | 43.8 | 37.4 | 47.7 | 36.7 | 49.1 | 44.1 | 51.9 | 45.5 | 43.5 | 44.7 | 45.6 | 44.3 | 47.0 | 45.4 | ||
| 1987 | 54.5 | 53.3 | 48.6 | 56.6 | 40.0 | 55.0 | 55.4 | 48.8 | 53.1 | 45.3 | 47.6 | 42.2 | 43.5 | 47.6 | 52.8 | 48.5 | 48.9 | ||
| 1986 | 23.1 | 44.7 | 37.7 | 47.2 | 42.6 | 38.2 | 39.1 | 58.3 | 32.3 | 49.0 | 41.4 | 34.3 | 35.4 | 41.9 | 46.2 | 42.3 | 41.5 | ||
| 1985 | 16.7 | 36.7 | 15.4 | 26.7 | 22.8 | 30.0 | 50.0 | 94.1 | 45.5 | 57.9 | 60.0 | 53.6 | 35.2 | 22.6 | 44.7 | 55.0 | 33.1 | ||
| 1984 | 0.0 | 0.0 | 0.0 | 0.0 | 0.0 | 8.3 | 31.0 | 15.2 | 18.5 | 11.8 | 22.6 | 2.9 | 2.0 | 0.0 | 20.3 | 17.4 | 13.6 | ||
| 1983 | 0.0 | 0.0 | 0.0 | 15.4 | 33.3 | 15.4 | 0.0 | 0.0 | 0.0 | - | 0.0 | 0.0 | 0.0 | 18.5 | 6.7 | 0.0 | 7.0 | ||
| 1982 | - | 0.0 | - | 0.0 | 0.0 | 0.0 | - | 0.0 | - | 0.0 | - | 0.0 | 0.0 | 0.0 | 0.0 | 0.0 | 0.0 | ||
Breeding data
Breeding records by month
Number of breeding records by breeding code and month, 2017 and all years| Breeding code | Jul | Aug | Sep | Oct | Nov | Dec | Jan | Feb | Mar | Apr | May | Jun |
|---|---|---|---|---|---|---|---|---|---|---|---|---|
| 2017 | ||||||||||||
| Breeding (BLA code) | 0 | 0 | 1 | 0 | 1 | 2 | 2 | 0 | 0 | 0 | 0 | 0 |
| Carrying Food | 0 | 0 | 2 | 3 | 1 | 3 | 3 | 1 | 0 | 0 | 0 | 0 |
| Copulating | 0 | 0 | 0 | 0 | 0 | 0 | 0 | 0 | 0 | 0 | 0 | 0 |
| Display | 0 | 0 | 0 | 1 | 1 | 0 | 0 | 0 | 0 | 0 | 0 | 0 |
| Dependent young | 0 | 0 | 0 | 11 | 14 | 15 | 23 | 8 | 1 | 0 | 0 | 0 |
| Faecal sac | 0 | 0 | 0 | 0 | 0 | 0 | 0 | 0 | 0 | 0 | 0 | 0 |
| Inspecting hollow | 0 | 0 | 1 | 0 | 0 | 0 | 0 | 0 | 0 | 0 | 0 | 0 |
| Nest building | 0 | 1 | 19 | 10 | 4 | 4 | 1 | 1 | 0 | 0 | 0 | 0 |
| Nest with eggs | 0 | 0 | 0 | 1 | 0 | 0 | 0 | 0 | 0 | 0 | 0 | 0 |
| Nest with young | 0 | 0 | 0 | 9 | 8 | 5 | 13 | 1 | 0 | 0 | 0 | 0 |
| On/leaving nest | 0 | 0 | 15 | 26 | 12 | 7 | 6 | 3 | 0 | 0 | 0 | 0 |
| All years | ||||||||||||
| Breeding (BLA code) | 0 | 0 | 3 | 6 | 13 | 12 | 4 | 2 | 0 | 0 | 0 | 0 |
| Carrying Food | 0 | 1 | 3 | 17 | 6 | 13 | 5 | 1 | 0 | 0 | 0 | 0 |
| Copulating | 0 | 0 | 0 | 2 | 1 | 0 | 0 | 0 | 0 | 0 | 0 | 0 |
| Display | 0 | 1 | 1 | 1 | 1 | 0 | 0 | 0 | 0 | 0 | 0 | 0 |
| Dependent young | 0 | 1 | 0 | 67 | 92 | 91 | 122 | 44 | 15 | 1 | 1 | 2 |
| Faecal sac | 0 | 0 | 0 | 1 | 0 | 0 | 0 | 0 | 0 | 0 | 0 | 0 |
| Inspecting hollow | 0 | 0 | 1 | 0 | 1 | 0 | 0 | 1 | 0 | 0 | 0 | 0 |
| Nest building | 2 | 22 | 69 | 98 | 30 | 31 | 4 | 3 | 1 | 1 | 0 | 0 |
| Nest with eggs | 0 | 2 | 22 | 28 | 14 | 7 | 2 | 0 | 0 | 1 | 0 | 0 |
| Nest with young | 0 | 0 | 8 | 81 | 62 | 43 | 35 | 7 | 1 | 0 | 1 | 0 |
| On/leaving nest | 0 | 1 | 55 | 177 | 67 | 36 | 21 | 7 | 2 | 0 | 0 | 0 |
Breeding records by year
Average number of breeding records per period by breeding code| Period | Breeding (BLA code) | Carrying Food | Copulating | Display | Dependent young | Faecal sac | Inspecting hollow | Nest building | Nest with eggs | Nest with young | On/leaving nest |
|---|---|---|---|---|---|---|---|---|---|---|---|
| All years | |||||||||||
| All | 1.1 | 1.3 | 0.1 | 0.1 | 12.1 | 0.0 | 0.1 | 7.2 | 2.1 | 6.6 | 10.2 |
| Previous years | |||||||||||
| All previous years | 1.0 | 0.9 | 0.1 | 0.1 | 10.4 | 0.0 | 0.1 | 6.3 | 2.1 | 5.8 | 8.5 |
| Previous 30 years | 1.1 | 1.1 | 0.1 | 0.1 | 12.1 | 0.0 | 0.1 | 7.3 | 2.5 | 6.7 | 9.8 |
| Previous 20 years | 1.7 | 1.1 | 0.1 | 0.0 | 11.0 | 0.0 | 0.1 | 5.5 | 0.3 | 6.7 | 13.3 |
| 10 year groups | |||||||||||
| [2007,2017) | 1.8 | 1.5 | 0.2 | 0.0 | 13.5 | 0.1 | 0.2 | 8.8 | 0.4 | 10.6 | 20.1 |
| [1997,2007) | 1.6 | 0.6 | 0.1 | 0.1 | 8.5 | 0.0 | 0.0 | 2.2 | 0.2 | 2.7 | 6.6 |
| [1987,1997) | 0.0 | 1.1 | 0.0 | 0.1 | 14.4 | 0.0 | 0.0 | 10.9 | 6.9 | 6.8 | 2.8 |
| 5 year groups | |||||||||||
| [2012,2017) | 2.2 | 1.8 | 0.0 | 0.0 | 16.2 | 0.0 | 0.4 | 9.8 | 0.8 | 14.4 | 25.6 |
| [2007,2012) | 1.4 | 1.2 | 0.4 | 0.0 | 10.8 | 0.2 | 0.0 | 7.8 | 0.0 | 6.8 | 14.6 |
| [2002,2007) | 1.2 | 0.8 | 0.0 | 0.2 | 9.0 | 0.0 | 0.0 | 3.0 | 0.0 | 4.2 | 6.8 |
| [1997,2002) | 2.0 | 0.4 | 0.2 | 0.0 | 8.0 | 0.0 | 0.0 | 1.4 | 0.4 | 1.2 | 6.4 |
| [1992,1997) | 0.0 | 0.4 | 0.0 | 0.2 | 5.8 | 0.0 | 0.0 | 1.4 | 0.2 | 1.4 | 3.6 |
| [1987,1992) | 0.0 | 1.8 | 0.0 | 0.0 | 23.0 | 0.0 | 0.0 | 20.4 | 13.6 | 12.2 | 2.0 |
| Year | |||||||||||
| 2017 | 6.0 | 13.0 | 0.0 | 2.0 | 72.0 | 0.0 | 1.0 | 40.0 | 1.0 | 36.0 | 69.0 |
| 2016 | 0.0 | 2.0 | 0.0 | 0.0 | 25.0 | 0.0 | 1.0 | 21.0 | 1.0 | 32.0 | 60.0 |
| 2015 | 0.0 | 2.0 | 0.0 | 0.0 | 33.0 | 0.0 | 1.0 | 11.0 | 0.0 | 20.0 | 35.0 |
| 2014 | 1.0 | 3.0 | 0.0 | 0.0 | 12.0 | 0.0 | 0.0 | 9.0 | 3.0 | 14.0 | 15.0 |
| 2013 | 0.0 | 0.0 | 0.0 | 0.0 | 7.0 | 0.0 | 0.0 | 5.0 | 0.0 | 4.0 | 14.0 |
| 2012 | 10.0 | 2.0 | 0.0 | 0.0 | 4.0 | 0.0 | 0.0 | 3.0 | 0.0 | 2.0 | 4.0 |
| 2011 | 1.0 | 0.0 | 0.0 | 0.0 | 13.0 | 0.0 | 0.0 | 6.0 | 0.0 | 3.0 | 19.0 |
| 2010 | 1.0 | 1.0 | 2.0 | 0.0 | 13.0 | 1.0 | 0.0 | 9.0 | 0.0 | 6.0 | 14.0 |
| 2009 | 2.0 | 2.0 | 0.0 | 0.0 | 9.0 | 0.0 | 0.0 | 10.0 | 0.0 | 6.0 | 11.0 |
| 2008 | 2.0 | 3.0 | 0.0 | 0.0 | 14.0 | 0.0 | 0.0 | 8.0 | 0.0 | 12.0 | 20.0 |
| 2007 | 1.0 | 0.0 | 0.0 | 0.0 | 5.0 | 0.0 | 0.0 | 6.0 | 0.0 | 7.0 | 9.0 |
| 2006 | 3.0 | 1.0 | 0.0 | 0.0 | 16.0 | 0.0 | 0.0 | 4.0 | 0.0 | 6.0 | 10.0 |
| 2005 | 0.0 | 3.0 | 0.0 | 1.0 | 5.0 | 0.0 | 0.0 | 5.0 | 0.0 | 4.0 | 11.0 |
| 2004 | 0.0 | 0.0 | 0.0 | 0.0 | 4.0 | 0.0 | 0.0 | 1.0 | 0.0 | 1.0 | 2.0 |
| 2003 | 0.0 | 0.0 | 0.0 | 0.0 | 10.0 | 0.0 | 0.0 | 2.0 | 0.0 | 3.0 | 5.0 |
| 2002 | 3.0 | 0.0 | 0.0 | 0.0 | 10.0 | 0.0 | 0.0 | 3.0 | 0.0 | 7.0 | 6.0 |
| 2001 | 5.0 | 0.0 | 1.0 | 0.0 | 7.0 | 0.0 | 0.0 | 2.0 | 0.0 | 1.0 | 6.0 |
| 2000 | 2.0 | 0.0 | 0.0 | 0.0 | 15.0 | 0.0 | 0.0 | 1.0 | 0.0 | 1.0 | 13.0 |
| 1999 | 3.0 | 1.0 | 0.0 | 0.0 | 13.0 | 0.0 | 0.0 | 3.0 | 0.0 | 2.0 | 9.0 |
| 1998 | 0.0 | 1.0 | 0.0 | 0.0 | 2.0 | 0.0 | 0.0 | 0.0 | 2.0 | 1.0 | 2.0 |
| 1997 | 0.0 | 0.0 | 0.0 | 0.0 | 3.0 | 0.0 | 0.0 | 1.0 | 0.0 | 1.0 | 2.0 |
| 1996 | 0.0 | 0.0 | 0.0 | 0.0 | 4.0 | 0.0 | 0.0 | 1.0 | 1.0 | 1.0 | 3.0 |
| 1995 | 0.0 | 1.0 | 0.0 | 0.0 | 4.0 | 0.0 | 0.0 | 0.0 | 0.0 | 0.0 | 3.0 |
| 1994 | 0.0 | 0.0 | 0.0 | 1.0 | 6.0 | 0.0 | 0.0 | 0.0 | 0.0 | 1.0 | 5.0 |
| 1993 | 0.0 | 0.0 | 0.0 | 0.0 | 8.0 | 0.0 | 0.0 | 1.0 | 0.0 | 1.0 | 5.0 |
| 1992 | 0.0 | 1.0 | 0.0 | 0.0 | 7.0 | 0.0 | 0.0 | 5.0 | 0.0 | 4.0 | 2.0 |
| 1991 | 0.0 | 1.0 | 0.0 | 0.0 | 6.0 | 0.0 | 0.0 | 8.0 | 0.0 | 0.0 | 5.0 |
| 1990 | 0.0 | 1.0 | 0.0 | 0.0 | 16.0 | 0.0 | 0.0 | 6.0 | 9.0 | 10.0 | 0.0 |
| 1989 | 0.0 | 5.0 | 0.0 | 0.0 | 33.0 | 0.0 | 0.0 | 38.0 | 18.0 | 21.0 | 3.0 |
| 1988 | 0.0 | 1.0 | 0.0 | 0.0 | 30.0 | 0.0 | 0.0 | 21.0 | 19.0 | 12.0 | 1.0 |
| 1987 | 0.0 | 1.0 | 0.0 | 0.0 | 30.0 | 0.0 | 0.0 | 29.0 | 22.0 | 18.0 | 1.0 |
| 1986 | 0.0 | 1.0 | 0.0 | 0.0 | 0.0 | 0.0 | 0.0 | 2.0 | 0.0 | 0.0 | 1.0 |
| 1985 | 0.0 | 0.0 | 0.0 | 0.0 | 0.0 | 0.0 | 0.0 | 0.0 | 0.0 | 1.0 | 1.0 |
| 1984 | 0.0 | 0.0 | 0.0 | 0.0 | 0.0 | 0.0 | 0.0 | 0.0 | 0.0 | 0.0 | 0.0 |
| 1983 | 0.0 | 0.0 | 0.0 | 0.0 | 0.0 | 0.0 | 0.0 | 0.0 | 0.0 | 0.0 | 0.0 |
| 1982 | 0.0 | 0.0 | 0.0 | 0.0 | 0.0 | 0.0 | 0.0 | 0.0 | 0.0 | 0.0 | 0.0 |
Distribution map
Distribution - 2017
This map shows the observed distribution of the Magpie-lark for 2017.
The red circles are the grid cells where Magpie-lark have been reported.
The transparency of the red circles indicate how many surveys sheets were submitted for that grid cell; the darker the red the more reliable the data. Of the 315 grid cells with reports, 83 had only one sheet; an example is grid number E3.
The size of the circle represents the reporting rate. The maximum reporting rate for Magpie-lark was 100.0% (eg grid number D6) and the minimum was 5.9% (eg grid number G18). 
Distribution - all years
This map shows the observed distribution of the Magpie-lark for all years.
The red circles are the grid cells where Magpie-lark have been reported.
The transparency of the red circles indicate how many surveys sheets were submitted for that grid cell; the darker the red the more reliable the data. Of the 703 grid cells with reports, 55 had only one sheet; an example is grid number S27.
The size of the circle represents the reporting rate. The maximum reporting rate for Magpie-lark was 100.0% (eg grid number A7) and the minimum was 0.6% (eg grid number Q21). 
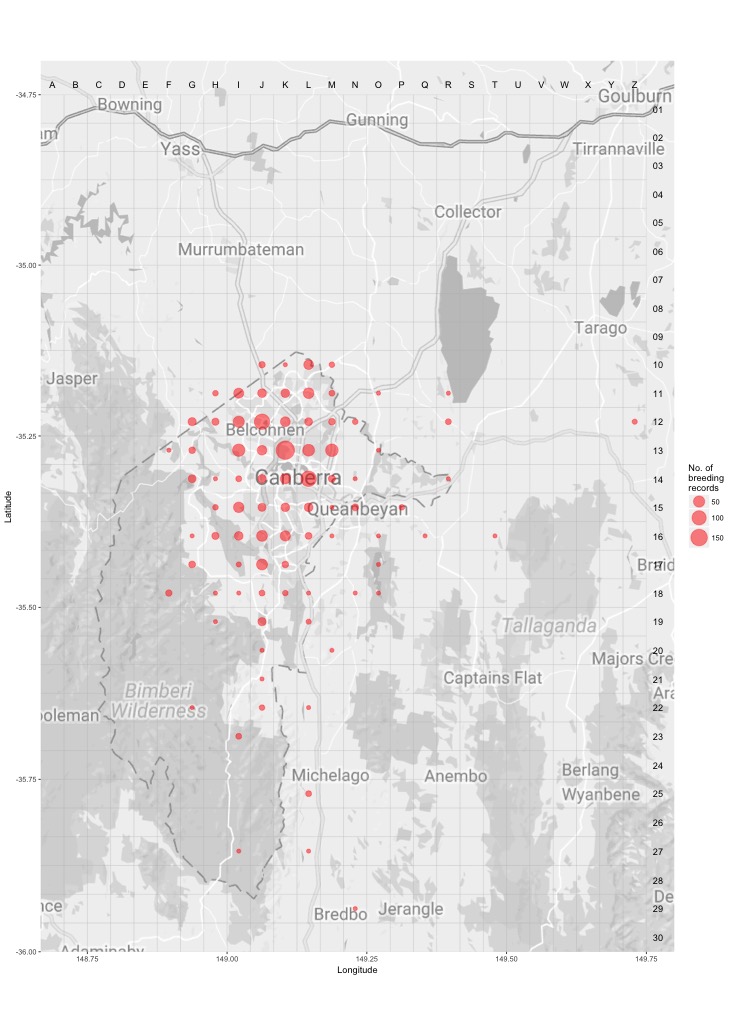
Breeding map
Breeding - 2017
This map shows the breeding distribution of the Magpie-lark for 2017.
The red circles are the grid cells where breeding activity for Magpie-lark have been reported.
The size of the circle represents the number of reports. 
Breeding - all years
This map shows the breeding distribution of the Magpie-lark for all years.
The red circles are the grid cells where breeding activity for Magpie-lark have been reported.
The size of the circle represents the number of reports.