Galah
Eolophus roseicapilla
ABR description
The following is extracted from the Annual Bird Report for the twelve months to June 2017.
Very common, breeding resident
Widespread throughout the region.
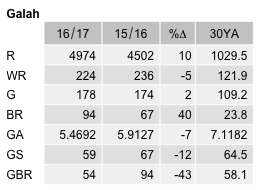
General: Ranks 6th in the reporting rate this year. The reporting rate (35.7%) was 7% lower than last year and 6% below the 30YA, representing a downward trend since 2012-2013 (46.5%). Recorded from all seasons. Average 8.9, median 4, with max 1000/15 Jun BuTYL GrS13(LeM1). 97 breeding records (67 last year): first br/2 Jul Mount Mugga Mugga GrK15 (CnM1), last dy/23 Mar Cook (DrC1) with a few early starts for the next season later in the year.
GBS: 2nd most abundant species recorded in the GBS Records from 100% of sites in all weeks of up to 200 individuals with little seasonal variation. Average 7.0, median 4 with max 200/29 Jan Cook (DiB1). Abundance 7% below last year and 23% below the 30YA with a 25% decline since 2009-10. Breeding recorded from 18 sites (22 last year): earliest ih/3wk Aug Fadden (CaR3) and last dy/2wk Apr Duffy (HaS3), with an early start to the next season co/3wk Jun Ainslie (HaS3).
Abundance
Abundance is the average number of birds of that species per survey. Where the species was observed (presence recorded) but the number of birds seen was not recorded, this is treated as a count of zero.
Abundance by year
This chart shows the abundance of Galah between 1982 and 2017. 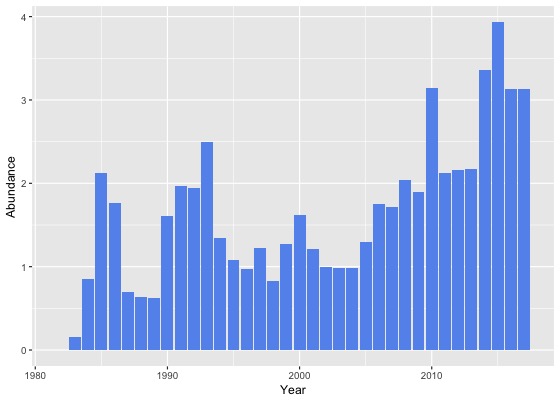
Abundance by month
This chart shows the monthly abundance of Galah. The blue lines show the abundance for the twelve months to June 2017 and the bars show the average abundance for the period 1982 to 2017. 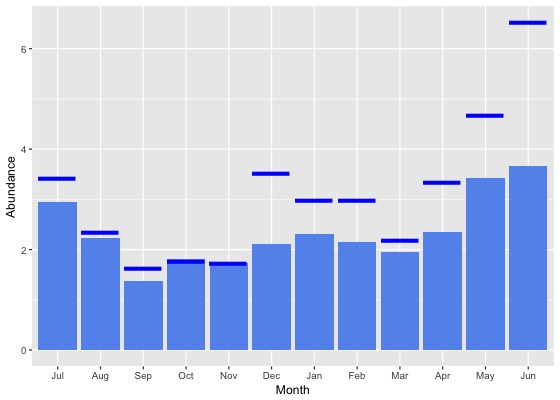
Abundance by season
This chart shows the seasonal abundance of Galah. The blue lines show the seasonal abundance for the twelve months to June 2017 and the bars show the average seasonal abundance for the period 1982 to 2017. 
Abundance data
| Month | Season | ||||||||||||||||||
|---|---|---|---|---|---|---|---|---|---|---|---|---|---|---|---|---|---|---|---|
| Period | Jul | Aug | Sep | Oct | Nov | Dec | Jan | Feb | Mar | Apr | May | Jun | Winter | Spring | Summer | Autumn | All | ||
| All years | |||||||||||||||||||
| All | 2.9 | 2.2 | 1.4 | 1.8 | 1.7 | 2.1 | 2.3 | 2.1 | 2.0 | 2.4 | 3.4 | 3.7 | 3.0 | 1.7 | 2.2 | 2.5 | 2.3 | ||
| Previous years | |||||||||||||||||||
| All previous years | 2.9 | 2.2 | 1.3 | 1.8 | 1.7 | 1.9 | 2.2 | 2.0 | 1.9 | 2.2 | 3.1 | 3.1 | 2.8 | 1.6 | 2.0 | 2.3 | 2.1 | ||
| Previous 30 years | 2.9 | 2.2 | 1.3 | 1.8 | 1.7 | 1.9 | 2.2 | 2.0 | 1.9 | 2.2 | 3.2 | 3.1 | 2.8 | 1.6 | 2.0 | 2.3 | 2.1 | ||
| Previous 20 years | 3.4 | 2.6 | 1.4 | 1.9 | 2.0 | 2.1 | 2.5 | 2.2 | 2.0 | 2.4 | 3.6 | 3.5 | 3.2 | 1.8 | 2.2 | 2.6 | 2.4 | ||
| 10 year groups | |||||||||||||||||||
| [2007,2017) | 4.5 | 3.1 | 1.6 | 2.1 | 2.6 | 2.6 | 2.8 | 2.6 | 2.5 | 2.9 | 4.3 | 4.4 | 4.1 | 2.1 | 2.7 | 3.0 | 2.8 | ||
| [1997,2007) | 1.6 | 1.4 | 1.0 | 1.2 | 0.9 | 1.0 | 1.4 | 1.3 | 1.2 | 1.3 | 1.9 | 1.5 | 1.5 | 1.0 | 1.2 | 1.4 | 1.3 | ||
| [1987,1997) | 1.1 | 1.1 | 1.2 | 1.1 | 0.8 | 1.1 | 0.8 | 0.9 | 1.2 | 1.0 | 1.7 | 1.1 | 1.1 | 1.0 | 0.9 | 1.3 | 1.1 | ||
| 5 year groups | |||||||||||||||||||
| [2012,2017) | 5.1 | 3.3 | 1.6 | 2.2 | 2.7 | 3.0 | 3.0 | 2.8 | 2.3 | 3.3 | 5.0 | 5.1 | 4.5 | 2.1 | 2.9 | 3.3 | 3.1 | ||
| [2007,2012) | 2.8 | 2.3 | 1.5 | 2.1 | 2.2 | 1.7 | 2.1 | 1.5 | 3.0 | 1.8 | 2.2 | 3.2 | 2.9 | 1.9 | 1.8 | 2.3 | 2.2 | ||
| [2002,2007) | 1.4 | 1.4 | 1.0 | 1.3 | 0.9 | 1.0 | 1.1 | 1.2 | 1.2 | 1.5 | 1.5 | 1.4 | 1.4 | 1.1 | 1.1 | 1.4 | 1.2 | ||
| [1997,2002) | 2.0 | 1.5 | 1.0 | 1.1 | 1.0 | 1.0 | 1.7 | 1.3 | 1.1 | 1.1 | 2.3 | 1.5 | 1.6 | 1.0 | 1.3 | 1.4 | 1.3 | ||
| [1992,1997) | 1.7 | 1.4 | 2.3 | 1.4 | 1.3 | 1.4 | 1.1 | 0.9 | 1.2 | 0.9 | 2.8 | 1.3 | 1.4 | 1.6 | 1.1 | 1.6 | 1.5 | ||
| [1987,1992) | 0.8 | 1.0 | 0.7 | 0.9 | 0.6 | 0.9 | 0.6 | 0.9 | 1.3 | 1.1 | 1.1 | 1.0 | 0.9 | 0.7 | 0.8 | 1.2 | 0.9 | ||
| Year | |||||||||||||||||||
| 2017 | 3.4 | 2.3 | 1.6 | 1.8 | 1.7 | 3.5 | 3.0 | 3.0 | 2.2 | 3.3 | 4.7 | 6.5 | 4.4 | 1.7 | 3.1 | 3.3 | 3.1 | ||
| 2016 | 6.1 | 3.2 | 1.8 | 2.2 | 2.9 | 3.7 | 3.7 | 2.1 | 2.0 | 3.5 | 4.4 | 4.0 | 4.3 | 2.3 | 3.1 | 3.2 | 3.1 | ||
| 2015 | 6.0 | 4.6 | 2.2 | 2.6 | 3.1 | 3.7 | 4.0 | 4.5 | 2.5 | 3.9 | 5.1 | 6.8 | 6.0 | 2.6 | 4.1 | 3.7 | 3.9 | ||
| 2014 | 4.2 | 2.4 | 1.2 | 2.7 | 3.4 | 2.9 | 2.9 | 3.3 | 3.1 | 4.6 | 6.7 | 4.8 | 3.9 | 2.4 | 3.0 | 4.4 | 3.4 | ||
| 2013 | 2.3 | 4.7 | 1.4 | 1.8 | 2.0 | 1.8 | 2.0 | 1.5 | 2.0 | 2.5 | 2.5 | 3.8 | 3.6 | 1.7 | 1.8 | 2.3 | 2.2 | ||
| 2012 | 4.0 | 1.1 | 0.9 | 1.5 | 1.6 | 2.2 | 0.8 | 2.2 | 1.6 | 1.4 | 8.1 | 5.5 | 3.7 | 1.4 | 1.5 | 2.9 | 2.2 | ||
| 2011 | 4.2 | 4.6 | 1.8 | 2.4 | 2.4 | 1.8 | 1.9 | 1.0 | 1.1 | 1.7 | 1.1 | 3.7 | 4.0 | 2.2 | 1.6 | 1.3 | 2.1 | ||
| 2010 | 2.1 | 1.4 | 1.4 | 2.5 | 2.4 | 1.9 | 2.6 | 3.8 | 8.8 | 2.3 | 2.8 | 4.5 | 3.3 | 2.2 | 2.5 | 5.2 | 3.1 | ||
| 2009 | 2.8 | 1.2 | 1.6 | 1.9 | 1.7 | 2.1 | 2.4 | 1.4 | 1.4 | 1.5 | 2.3 | 2.6 | 2.4 | 1.8 | 2.0 | 1.7 | 1.9 | ||
| 2008 | 1.9 | 2.3 | 1.7 | 1.9 | 3.0 | 1.6 | 3.6 | 1.2 | 1.8 | 1.3 | 1.8 | 3.6 | 2.8 | 2.0 | 2.1 | 1.5 | 2.0 | ||
| 2007 | 3.1 | 1.7 | 0.8 | 1.5 | 1.8 | 1.4 | 0.9 | 1.5 | 1.9 | 2.3 | 4.3 | 1.7 | 2.0 | 1.4 | 1.2 | 2.5 | 1.7 | ||
| 2006 | 2.5 | 2.8 | 1.2 | 2.2 | 1.2 | 1.0 | 2.0 | 1.7 | 1.6 | 2.1 | 1.8 | 1.3 | 2.0 | 1.7 | 1.5 | 1.8 | 1.8 | ||
| 2005 | 0.8 | 0.9 | 1.1 | 1.1 | 1.1 | 1.3 | 0.8 | 1.2 | 1.5 | 0.9 | 1.9 | 2.1 | 1.5 | 1.1 | 1.1 | 1.5 | 1.3 | ||
| 2004 | 1.5 | 1.3 | 1.0 | 1.0 | 0.6 | 0.7 | 0.7 | 0.7 | 1.1 | 1.3 | 0.8 | 0.8 | 1.2 | 0.9 | 0.7 | 1.1 | 1.0 | ||
| 2003 | 0.9 | 0.8 | 0.8 | 0.5 | 0.6 | 1.0 | 0.7 | 1.0 | 0.8 | 2.3 | 1.5 | 0.9 | 0.9 | 0.6 | 0.9 | 1.5 | 1.0 | ||
| 2002 | 1.2 | 1.4 | 0.6 | 0.8 | 1.0 | 0.9 | 1.1 | 1.3 | 0.9 | 0.4 | 0.9 | 1.8 | 1.5 | 0.8 | 1.0 | 0.7 | 1.0 | ||
| 2001 | 1.2 | 1.6 | 1.1 | 1.1 | 1.1 | 1.4 | 1.4 | 0.7 | 1.3 | 1.2 | 1.7 | 1.1 | 1.2 | 1.1 | 1.2 | 1.3 | 1.2 | ||
| 2000 | 1.7 | 1.5 | 0.9 | 1.0 | 1.2 | 1.0 | 2.5 | 1.6 | 1.3 | 1.4 | 4.2 | 2.9 | 2.1 | 1.1 | 1.6 | 1.9 | 1.6 | ||
| 1999 | 1.7 | 1.1 | 1.0 | 1.0 | 1.3 | 1.2 | 1.3 | 2.2 | 0.9 | 1.1 | 1.5 | 1.4 | 1.3 | 1.1 | 1.6 | 1.2 | 1.3 | ||
| 1998 | 1.4 | 2.4 | 0.9 | 1.3 | 0.4 | 0.5 | 1.4 | 0.8 | 0.1 | 0.4 | 0.8 | 0.6 | 1.3 | 0.8 | 0.8 | 0.3 | 0.8 | ||
| 1997 | 4.9 | 1.1 | 0.7 | 0.8 | 0.5 | 0.6 | 0.7 | 0.8 | 0.9 | 0.6 | 4.2 | 0.1 | 2.3 | 0.6 | 0.7 | 1.5 | 1.2 | ||
| 1996 | 1.0 | 0.6 | 0.6 | 1.1 | 0.7 | 0.8 | 0.9 | 0.4 | 0.3 | 0.9 | 3.8 | 1.5 | 1.0 | 0.9 | 0.7 | 1.4 | 1.0 | ||
| 1995 | 1.0 | 1.0 | 0.6 | 1.4 | 0.4 | 1.5 | 1.0 | 0.5 | 1.1 | 0.7 | 3.7 | 0.4 | 0.8 | 0.9 | 1.0 | 1.6 | 1.1 | ||
| 1994 | 1.6 | 2.5 | 3.6 | 1.0 | 1.6 | 0.9 | 1.7 | 0.6 | 0.6 | 0.6 | 1.5 | 0.5 | 1.5 | 1.9 | 1.1 | 0.8 | 1.3 | ||
| 1993 | 3.7 | 2.2 | 4.0 | 2.4 | 2.6 | 1.4 | 1.6 | 3.2 | 2.6 | 1.6 | 2.2 | 2.7 | 2.8 | 3.0 | 1.9 | 2.2 | 2.5 | ||
| 1992 | 1.9 | 1.0 | 3.4 | 1.6 | 1.8 | 2.5 | 0.7 | 1.1 | 1.5 | 1.4 | 3.3 | 2.0 | 1.7 | 2.3 | 1.5 | 2.1 | 1.9 | ||
| 1991 | 1.2 | 2.9 | 1.4 | 1.3 | 1.3 | 1.0 | 1.5 | 3.5 | 1.7 | 4.7 | 3.1 | 2.1 | 2.0 | 1.3 | 1.9 | 3.1 | 2.0 | ||
| 1990 | 0.7 | 0.8 | 0.5 | 1.0 | 0.3 | 0.8 | 0.5 | 1.1 | 6.6 | 2.1 | 4.0 | 3.2 | 1.2 | 0.6 | 0.8 | 4.3 | 1.6 | ||
| 1989 | 0.6 | 0.9 | 0.6 | 0.8 | 0.5 | 0.6 | 0.4 | 0.9 | 0.5 | 0.6 | 0.6 | 0.6 | 0.7 | 0.6 | 0.6 | 0.6 | 0.6 | ||
| 1988 | 0.5 | 0.6 | 0.7 | 0.8 | 0.4 | 1.1 | 0.4 | 0.5 | 0.4 | 0.9 | 0.5 | 0.7 | 0.6 | 0.6 | 0.7 | 0.6 | 0.6 | ||
| 1987 | 6.9 | 0.3 | 0.6 | 1.2 | 0.6 | 1.1 | 0.6 | 0.7 | 0.5 | 0.5 | 0.5 | 0.5 | 0.8 | 0.8 | 0.8 | 0.5 | 0.7 | ||
| 1986 | 0.3 | 2.9 | 0.7 | 3.4 | 2.9 | 4.7 | 0.1 | 1.1 | 0.3 | 0.9 | 0.7 | 2.2 | 2.0 | 2.2 | 2.2 | 0.7 | 1.8 | ||
| 1985 | 0.1 | 1.4 | 1.1 | 1.6 | 1.1 | 0.6 | 0.5 | 3.7 | 1.0 | 6.1 | 3.1 | 10.9 | 4.0 | 1.3 | 1.2 | 4.0 | 2.1 | ||
| 1984 | 0.0 | 0.0 | 0.0 | 0.0 | 0.0 | 1.2 | 0.8 | 0.3 | 1.3 | 1.5 | 1.5 | 0.6 | 0.4 | 0.0 | 0.6 | 1.4 | 0.8 | ||
| 1983 | 0.0 | 1.0 | 0.0 | 0.0 | 0.1 | 0.2 | 0.0 | 0.1 | 0.0 | - | 0.0 | 0.0 | 0.4 | 0.0 | 0.1 | 0.0 | 0.2 | ||
| 1982 | - | 0.0 | - | 0.0 | 0.0 | 0.0 | - | 0.0 | - | 0.0 | - | 0.0 | 0.0 | 0.0 | 0.0 | 0.0 | 0.0 | ||
Reporting rates
Reporting rate is the proportion of all surveys in which the species was present.
Reporting rate by year
This chart shows the reporting rate of Galah each year between 1982 and 2017. 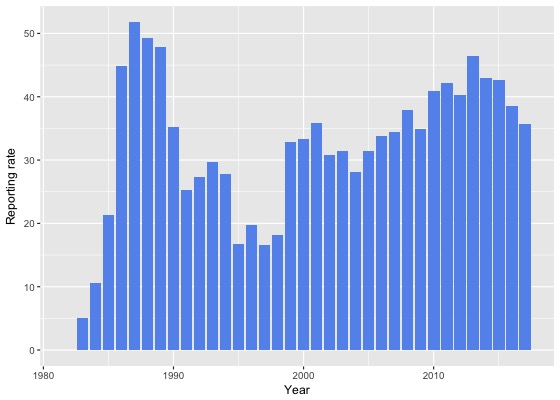
Reporting rate by month
This chart shows the reporting rate by month of Galah. The blue lines show the reporting rate for the twelve months to June 2017 and the bars show the average reporting rate for the period 1982 to 2017. 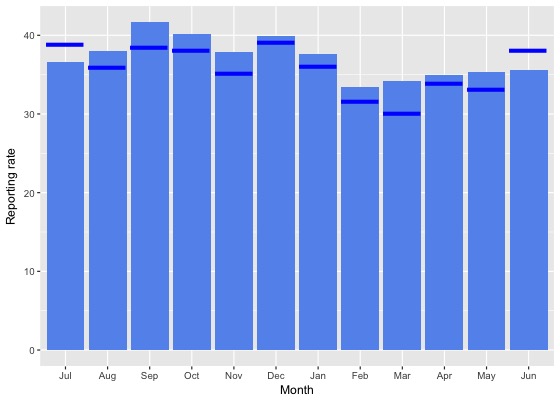
Reporting rate by season
This chart shows the seasonal reporting rate of Galah. The blue lines show the seasonal reporting rate for the twelve months to June 2017 and the bars show the average seasonal reporting rate for the period 1982 to 2017. 
Reporting rate data
| Month | Season | ||||||||||||||||||
|---|---|---|---|---|---|---|---|---|---|---|---|---|---|---|---|---|---|---|---|
| Period | Jul | Aug | Sep | Oct | Nov | Dec | Jan | Feb | Mar | Apr | May | Jun | Winter | Spring | Summer | Autumn | All | ||
| All years | |||||||||||||||||||
| All | 36.7 | 38.0 | 41.6 | 40.1 | 37.9 | 39.9 | 37.7 | 33.5 | 34.1 | 35.0 | 35.3 | 35.6 | 36.6 | 40.0 | 37.3 | 34.8 | 37.3 | ||
| Previous years | |||||||||||||||||||
| All previous years | 36.3 | 38.4 | 42.1 | 40.4 | 38.4 | 40.0 | 38.0 | 33.9 | 34.9 | 35.2 | 35.8 | 35.1 | 36.5 | 40.4 | 37.6 | 35.2 | 37.6 | ||
| Previous 30 years | 36.6 | 38.7 | 42.2 | 40.7 | 38.6 | 40.3 | 38.2 | 34.1 | 35.0 | 35.2 | 36.1 | 35.4 | 36.7 | 40.6 | 37.8 | 35.3 | 37.8 | ||
| Previous 20 years | 36.4 | 39.1 | 41.9 | 40.1 | 38.6 | 40.5 | 38.5 | 33.5 | 35.1 | 35.1 | 35.9 | 35.5 | 36.8 | 40.3 | 37.9 | 35.3 | 37.7 | ||
| 10 year groups | |||||||||||||||||||
| [2007,2017) | 41.5 | 41.6 | 44.3 | 41.8 | 43.3 | 45.3 | 41.5 | 36.0 | 36.9 | 37.0 | 38.2 | 38.9 | 40.4 | 42.9 | 41.3 | 37.3 | 40.6 | ||
| [1997,2007) | 27.7 | 33.8 | 37.3 | 34.4 | 29.1 | 31.2 | 28.4 | 27.0 | 31.1 | 30.3 | 30.3 | 28.1 | 29.5 | 33.9 | 29.3 | 30.6 | 31.0 | ||
| [1987,1997) | 37.3 | 37.4 | 43.6 | 43.8 | 38.5 | 39.3 | 36.2 | 36.7 | 34.4 | 35.3 | 36.8 | 34.7 | 36.5 | 41.8 | 37.4 | 35.5 | 38.0 | ||
| 5 year groups | |||||||||||||||||||
| [2012,2017) | 43.8 | 43.7 | 43.6 | 43.3 | 44.6 | 46.9 | 43.1 | 36.3 | 36.7 | 38.3 | 39.0 | 39.4 | 42.0 | 43.8 | 42.2 | 37.8 | 41.5 | ||
| [2007,2012) | 34.8 | 34.1 | 45.7 | 39.1 | 39.8 | 41.9 | 35.9 | 34.6 | 37.7 | 34.0 | 35.7 | 38.1 | 36.4 | 41.0 | 38.2 | 35.8 | 38.3 | ||
| [2002,2007) | 28.6 | 33.3 | 40.1 | 33.8 | 26.2 | 33.2 | 26.1 | 25.9 | 32.0 | 29.5 | 28.4 | 30.7 | 30.6 | 33.9 | 29.3 | 30.3 | 31.2 | ||
| [1997,2002) | 26.3 | 34.3 | 33.9 | 35.1 | 32.5 | 28.7 | 30.9 | 28.1 | 29.7 | 31.2 | 32.8 | 24.5 | 27.9 | 33.8 | 29.2 | 31.0 | 30.7 | ||
| [1992,1997) | 23.7 | 22.2 | 27.5 | 28.0 | 31.1 | 23.8 | 21.2 | 17.9 | 18.9 | 18.9 | 25.5 | 18.3 | 21.3 | 28.9 | 21.2 | 20.9 | 23.4 | ||
| [1987,1992) | 43.4 | 45.7 | 51.3 | 52.4 | 42.0 | 46.0 | 44.5 | 43.8 | 43.7 | 44.7 | 42.6 | 44.0 | 44.4 | 48.3 | 44.8 | 43.7 | 45.5 | ||
| Year | |||||||||||||||||||
| 2017 | 38.9 | 36.0 | 38.5 | 38.0 | 35.2 | 39.1 | 36.1 | 31.6 | 30.1 | 33.9 | 33.1 | 38.1 | 37.7 | 37.3 | 35.5 | 32.3 | 35.7 | ||
| 2016 | 45.8 | 40.2 | 40.2 | 41.2 | 44.2 | 43.2 | 40.5 | 29.3 | 34.3 | 35.8 | 35.8 | 37.7 | 41.0 | 41.7 | 37.3 | 35.3 | 38.6 | ||
| 2015 | 43.6 | 50.6 | 45.9 | 45.5 | 40.8 | 45.8 | 44.9 | 40.7 | 34.2 | 36.6 | 44.3 | 41.6 | 44.6 | 44.3 | 43.9 | 37.8 | 42.6 | ||
| 2014 | 48.5 | 46.2 | 44.4 | 48.2 | 47.0 | 39.9 | 46.4 | 38.4 | 38.2 | 41.9 | 37.9 | 36.8 | 42.1 | 46.8 | 42.7 | 39.4 | 42.9 | ||
| 2013 | 39.1 | 37.6 | 48.3 | 38.6 | 50.5 | 55.2 | 50.7 | 49.3 | 45.7 | 47.7 | 42.7 | 42.2 | 39.8 | 44.6 | 52.1 | 45.8 | 46.5 | ||
| 2012 | 40.3 | 45.7 | 42.5 | 44.1 | 44.3 | 50.1 | 34.1 | 33.7 | 34.8 | 34.7 | 34.8 | 38.9 | 41.4 | 43.7 | 39.3 | 34.8 | 40.3 | ||
| 2011 | 41.5 | 38.4 | 45.3 | 45.3 | 39.4 | 48.5 | 48.5 | 46.6 | 39.4 | 31.3 | 34.5 | 41.3 | 40.7 | 44.2 | 48.0 | 35.1 | 42.1 | ||
| 2010 | 38.5 | 32.5 | 46.8 | 44.2 | 43.5 | 44.0 | 34.3 | 37.6 | 47.2 | 31.5 | 36.3 | 37.8 | 36.7 | 44.8 | 39.5 | 39.1 | 40.8 | ||
| 2009 | 36.0 | 40.6 | 44.7 | 34.4 | 29.0 | 35.4 | 27.3 | 20.8 | 34.9 | 36.5 | 29.0 | 41.0 | 39.4 | 35.9 | 29.0 | 34.2 | 34.9 | ||
| 2008 | 33.1 | 34.8 | 50.6 | 37.1 | 43.6 | 45.9 | 38.1 | 27.8 | 25.8 | 32.3 | 37.8 | 41.1 | 37.1 | 41.7 | 39.5 | 31.3 | 37.9 | ||
| 2007 | 23.1 | 24.1 | 40.2 | 35.3 | 47.3 | 33.6 | 24.4 | 30.4 | 37.0 | 40.2 | 43.1 | 30.6 | 27.9 | 38.9 | 29.5 | 39.5 | 34.5 | ||
| 2006 | 28.9 | 36.9 | 44.5 | 37.3 | 26.2 | 35.2 | 36.0 | 31.9 | 29.9 | 34.4 | 25.4 | 33.7 | 32.9 | 37.0 | 34.6 | 30.2 | 33.8 | ||
| 2005 | 25.0 | 22.4 | 40.9 | 28.2 | 24.8 | 35.1 | 22.0 | 27.2 | 35.5 | 29.5 | 29.9 | 37.0 | 30.7 | 33.1 | 29.8 | 31.9 | 31.5 | ||
| 2004 | 31.0 | 37.5 | 34.6 | 38.4 | 25.6 | 24.9 | 21.2 | 18.2 | 29.0 | 23.6 | 21.4 | 23.3 | 30.5 | 33.0 | 22.2 | 25.3 | 28.1 | ||
| 2003 | 18.8 | 33.1 | 43.2 | 33.7 | 24.3 | 35.2 | 23.0 | 28.6 | 35.0 | 35.5 | 30.2 | 24.2 | 25.7 | 34.0 | 30.0 | 34.1 | 31.4 | ||
| 2002 | 34.3 | 34.7 | 36.3 | 29.2 | 30.0 | 34.8 | 26.4 | 21.7 | 31.4 | 22.6 | 35.3 | 29.6 | 32.6 | 31.7 | 29.7 | 29.0 | 30.7 | ||
| 2001 | 30.7 | 45.2 | 37.1 | 38.7 | 48.3 | 44.2 | 31.0 | 30.9 | 30.7 | 36.1 | 33.5 | 25.1 | 32.8 | 40.2 | 36.4 | 33.0 | 35.8 | ||
| 2000 | 30.2 | 41.2 | 39.5 | 43.6 | 33.8 | 23.1 | 31.0 | 28.6 | 33.5 | 37.2 | 30.0 | 31.2 | 34.2 | 39.1 | 27.2 | 34.3 | 33.4 | ||
| 1999 | 29.4 | 18.6 | 37.4 | 34.6 | 39.6 | 33.1 | 37.2 | 32.9 | 34.1 | 27.3 | 36.4 | 27.6 | 25.2 | 37.2 | 34.3 | 32.4 | 32.8 | ||
| 1998 | 18.9 | 26.4 | 23.6 | 18.5 | 16.8 | 9.4 | 27.9 | 13.2 | 10.8 | 17.9 | 29.6 | 17.3 | 20.6 | 19.8 | 15.9 | 15.7 | 18.2 | ||
| 1997 | 11.5 | 19.0 | 19.1 | 19.7 | 12.0 | 16.3 | 17.6 | 19.3 | 22.5 | 21.1 | 24.4 | 4.2 | 11.1 | 16.5 | 17.5 | 22.2 | 16.6 | ||
| 1996 | 19.4 | 14.9 | 20.0 | 27.2 | 19.4 | 21.2 | 20.4 | 14.1 | 9.8 | 21.9 | 31.0 | 20.7 | 18.1 | 22.6 | 18.8 | 18.8 | 19.7 | ||
| 1995 | 15.1 | 13.2 | 14.6 | 20.7 | 11.8 | 16.1 | 19.5 | 17.5 | 18.4 | 16.9 | 22.1 | 16.0 | 14.6 | 16.4 | 17.9 | 18.7 | 16.8 | ||
| 1994 | 33.3 | 41.6 | 48.5 | 32.6 | 45.6 | 23.9 | 25.0 | 13.8 | 20.5 | 16.0 | 12.5 | 16.9 | 29.5 | 42.4 | 20.9 | 16.4 | 27.8 | ||
| 1993 | 22.4 | 32.1 | 30.6 | 37.3 | 48.5 | 41.3 | 22.4 | 21.9 | 24.7 | 20.0 | 29.9 | 20.3 | 25.5 | 38.9 | 29.1 | 25.2 | 29.7 | ||
| 1992 | 33.8 | 14.8 | 30.6 | 29.8 | 34.7 | 25.4 | 20.7 | 29.3 | 23.9 | 25.4 | 34.2 | 18.3 | 22.9 | 31.5 | 24.7 | 28.2 | 27.3 | ||
| 1991 | 20.5 | 19.1 | 24.4 | 28.2 | 35.1 | 14.9 | 19.6 | 32.0 | 25.4 | 35.6 | 23.0 | 32.0 | 22.1 | 29.4 | 21.1 | 27.9 | 25.3 | ||
| 1990 | 46.5 | 38.9 | 28.0 | 31.6 | 27.1 | 38.9 | 33.3 | 32.4 | 43.2 | 27.4 | 28.8 | 34.2 | 40.9 | 28.9 | 34.9 | 33.5 | 35.2 | ||
| 1989 | 47.4 | 53.0 | 49.8 | 56.5 | 46.0 | 45.7 | 43.1 | 44.3 | 47.2 | 46.7 | 42.1 | 48.2 | 49.8 | 51.2 | 44.4 | 45.5 | 47.9 | ||
| 1988 | 49.6 | 53.7 | 67.4 | 52.7 | 42.2 | 47.7 | 44.2 | 44.6 | 42.1 | 53.5 | 47.0 | 49.3 | 51.1 | 52.1 | 45.5 | 47.4 | 49.3 | ||
| 1987 | 63.6 | 40.0 | 59.1 | 65.6 | 46.3 | 58.3 | 57.4 | 48.8 | 47.8 | 44.4 | 48.9 | 41.7 | 42.6 | 56.0 | 54.5 | 47.0 | 51.7 | ||
| 1986 | 30.8 | 50.0 | 50.9 | 47.2 | 55.3 | 67.6 | 13.0 | 44.4 | 29.0 | 49.0 | 34.5 | 40.0 | 41.4 | 51.5 | 45.2 | 39.6 | 44.9 | ||
| 1985 | 6.7 | 16.7 | 17.3 | 22.1 | 14.0 | 13.3 | 25.0 | 41.2 | 27.3 | 47.4 | 40.0 | 39.3 | 20.5 | 18.5 | 20.0 | 40.0 | 21.3 | ||
| 1984 | 0.0 | 0.0 | 0.0 | 0.0 | 0.0 | 8.3 | 20.7 | 6.1 | 11.1 | 20.6 | 12.9 | 5.9 | 4.1 | 0.0 | 12.2 | 15.2 | 10.6 | ||
| 1983 | 0.0 | 8.3 | 0.0 | 0.0 | 11.1 | 15.4 | 0.0 | 9.1 | 0.0 | - | 0.0 | 0.0 | 3.4 | 3.7 | 10.0 | 0.0 | 5.0 | ||
| 1982 | - | 0.0 | - | 0.0 | 0.0 | 0.0 | - | 0.0 | - | 0.0 | - | 0.0 | 0.0 | 0.0 | 0.0 | 0.0 | 0.0 | ||
Breeding data
Breeding records by month
Number of breeding records by breeding code and month, 2017 and all years| Breeding code | Jul | Aug | Sep | Oct | Nov | Dec | Jan | Feb | Mar | Apr | May | Jun |
|---|---|---|---|---|---|---|---|---|---|---|---|---|
| 2017 | ||||||||||||
| Breeding (BLA code) | 1 | 0 | 0 | 0 | 0 | 0 | 0 | 0 | 0 | 0 | 0 | 0 |
| Carrying Food | 0 | 0 | 0 | 0 | 0 | 0 | 0 | 0 | 0 | 0 | 0 | 0 |
| Copulating | 0 | 0 | 0 | 0 | 0 | 0 | 0 | 0 | 0 | 0 | 0 | 0 |
| Display | 0 | 0 | 0 | 1 | 0 | 0 | 0 | 0 | 0 | 0 | 0 | 0 |
| Dependent young | 0 | 0 | 0 | 1 | 4 | 14 | 15 | 11 | 4 | 0 | 0 | 0 |
| Faecal sac | 0 | 0 | 0 | 0 | 0 | 0 | 0 | 0 | 0 | 0 | 0 | 0 |
| Inspecting hollow | 4 | 8 | 3 | 6 | 1 | 0 | 2 | 0 | 0 | 0 | 0 | 2 |
| Nest building | 2 | 3 | 1 | 3 | 1 | 0 | 0 | 0 | 0 | 0 | 0 | 1 |
| Nest with eggs | 0 | 0 | 0 | 0 | 0 | 0 | 0 | 0 | 0 | 0 | 0 | 0 |
| Nest with young | 0 | 0 | 0 | 0 | 0 | 1 | 0 | 0 | 0 | 0 | 0 | 0 |
| On/leaving nest | 0 | 0 | 2 | 5 | 0 | 0 | 1 | 0 | 0 | 0 | 0 | 0 |
| All years | ||||||||||||
| Breeding (BLA code) | 6 | 3 | 2 | 3 | 4 | 5 | 1 | 0 | 0 | 0 | 0 | 0 |
| Carrying Food | 0 | 0 | 0 | 0 | 0 | 1 | 0 | 0 | 0 | 0 | 0 | 0 |
| Copulating | 0 | 0 | 3 | 0 | 0 | 0 | 0 | 0 | 0 | 1 | 0 | 2 |
| Display | 1 | 0 | 1 | 4 | 1 | 0 | 0 | 0 | 0 | 0 | 0 | 0 |
| Dependent young | 0 | 1 | 1 | 5 | 45 | 96 | 78 | 36 | 7 | 1 | 0 | 0 |
| Faecal sac | 0 | 0 | 0 | 0 | 0 | 0 | 0 | 0 | 0 | 0 | 0 | 0 |
| Inspecting hollow | 25 | 38 | 68 | 91 | 20 | 17 | 6 | 2 | 7 | 5 | 10 | 14 |
| Nest building | 5 | 18 | 24 | 25 | 8 | 8 | 1 | 0 | 2 | 0 | 1 | 2 |
| Nest with eggs | 0 | 0 | 1 | 3 | 1 | 0 | 0 | 0 | 0 | 0 | 0 | 0 |
| Nest with young | 0 | 0 | 1 | 11 | 9 | 3 | 1 | 0 | 0 | 0 | 0 | 0 |
| On/leaving nest | 0 | 0 | 12 | 45 | 13 | 2 | 3 | 2 | 1 | 0 | 0 | 0 |
Breeding records by year
Average number of breeding records per period by breeding code| Period | Breeding (BLA code) | Carrying Food | Copulating | Display | Dependent young | Faecal sac | Inspecting hollow | Nest building | Nest with eggs | Nest with young | On/leaving nest |
|---|---|---|---|---|---|---|---|---|---|---|---|
| All years | |||||||||||
| All | 0.7 | 0.0 | 0.2 | 0.2 | 7.5 | 0.0 | 8.4 | 2.6 | 0.1 | 0.7 | 2.2 |
| Previous years | |||||||||||
| All previous years | 0.7 | 0.0 | 0.2 | 0.2 | 6.3 | 0.0 | 7.9 | 2.4 | 0.1 | 0.7 | 2.0 |
| Previous 30 years | 0.8 | 0.0 | 0.2 | 0.2 | 7.4 | 0.0 | 9.2 | 2.7 | 0.2 | 0.8 | 2.3 |
| Previous 20 years | 1.1 | 0.0 | 0.2 | 0.3 | 6.3 | 0.0 | 13.2 | 1.5 | 0.0 | 0.6 | 3.4 |
| 10 year groups | |||||||||||
| [2007,2017) | 1.6 | 0.0 | 0.4 | 0.4 | 9.7 | 0.0 | 20.1 | 2.5 | 0.1 | 0.8 | 5.1 |
| [1997,2007) | 0.7 | 0.0 | 0.1 | 0.2 | 3.0 | 0.0 | 6.2 | 0.5 | 0.0 | 0.4 | 1.6 |
| [1987,1997) | 0.0 | 0.1 | 0.1 | 0.0 | 9.4 | 0.0 | 1.3 | 5.2 | 0.4 | 1.2 | 0.3 |
| 5 year groups | |||||||||||
| [2012,2017) | 1.6 | 0.0 | 0.6 | 0.6 | 15.4 | 0.0 | 20.4 | 3.2 | 0.2 | 0.6 | 5.6 |
| [2007,2012) | 1.6 | 0.0 | 0.2 | 0.2 | 4.0 | 0.0 | 19.8 | 1.8 | 0.0 | 1.0 | 4.6 |
| [2002,2007) | 0.4 | 0.0 | 0.2 | 0.4 | 3.2 | 0.0 | 8.4 | 0.4 | 0.0 | 0.2 | 2.2 |
| [1997,2002) | 1.0 | 0.0 | 0.0 | 0.0 | 2.8 | 0.0 | 4.0 | 0.6 | 0.0 | 0.6 | 1.0 |
| [1992,1997) | 0.0 | 0.0 | 0.2 | 0.0 | 1.8 | 0.0 | 2.4 | 0.0 | 0.0 | 0.0 | 0.4 |
| [1987,1992) | 0.0 | 0.2 | 0.0 | 0.0 | 17.0 | 0.0 | 0.2 | 10.4 | 0.8 | 2.4 | 0.2 |
| Year | |||||||||||
| 2017 | 1.0 | 0.0 | 0.0 | 1.0 | 49.0 | 0.0 | 26.0 | 11.0 | 0.0 | 1.0 | 8.0 |
| 2016 | 0.0 | 0.0 | 0.0 | 1.0 | 30.0 | 0.0 | 25.0 | 6.0 | 0.0 | 0.0 | 5.0 |
| 2015 | 1.0 | 0.0 | 1.0 | 0.0 | 31.0 | 0.0 | 16.0 | 4.0 | 1.0 | 2.0 | 7.0 |
| 2014 | 0.0 | 0.0 | 2.0 | 0.0 | 11.0 | 0.0 | 16.0 | 2.0 | 0.0 | 0.0 | 5.0 |
| 2013 | 2.0 | 0.0 | 0.0 | 1.0 | 3.0 | 0.0 | 27.0 | 2.0 | 0.0 | 0.0 | 3.0 |
| 2012 | 5.0 | 0.0 | 0.0 | 1.0 | 2.0 | 0.0 | 18.0 | 2.0 | 0.0 | 1.0 | 8.0 |
| 2011 | 0.0 | 0.0 | 0.0 | 0.0 | 4.0 | 0.0 | 18.0 | 2.0 | 0.0 | 0.0 | 3.0 |
| 2010 | 1.0 | 0.0 | 1.0 | 1.0 | 4.0 | 0.0 | 23.0 | 3.0 | 0.0 | 4.0 | 4.0 |
| 2009 | 1.0 | 0.0 | 0.0 | 0.0 | 2.0 | 0.0 | 22.0 | 3.0 | 0.0 | 0.0 | 11.0 |
| 2008 | 1.0 | 0.0 | 0.0 | 0.0 | 5.0 | 0.0 | 25.0 | 1.0 | 0.0 | 0.0 | 5.0 |
| 2007 | 5.0 | 0.0 | 0.0 | 0.0 | 5.0 | 0.0 | 11.0 | 0.0 | 0.0 | 1.0 | 0.0 |
| 2006 | 1.0 | 0.0 | 0.0 | 1.0 | 3.0 | 0.0 | 12.0 | 0.0 | 0.0 | 1.0 | 3.0 |
| 2005 | 0.0 | 0.0 | 0.0 | 0.0 | 4.0 | 0.0 | 11.0 | 1.0 | 0.0 | 0.0 | 3.0 |
| 2004 | 0.0 | 0.0 | 1.0 | 1.0 | 2.0 | 0.0 | 12.0 | 1.0 | 0.0 | 0.0 | 1.0 |
| 2003 | 1.0 | 0.0 | 0.0 | 0.0 | 1.0 | 0.0 | 2.0 | 0.0 | 0.0 | 0.0 | 1.0 |
| 2002 | 0.0 | 0.0 | 0.0 | 0.0 | 6.0 | 0.0 | 5.0 | 0.0 | 0.0 | 0.0 | 3.0 |
| 2001 | 1.0 | 0.0 | 0.0 | 0.0 | 4.0 | 0.0 | 6.0 | 1.0 | 0.0 | 1.0 | 1.0 |
| 2000 | 4.0 | 0.0 | 0.0 | 0.0 | 6.0 | 0.0 | 6.0 | 0.0 | 0.0 | 0.0 | 1.0 |
| 1999 | 0.0 | 0.0 | 0.0 | 0.0 | 4.0 | 0.0 | 6.0 | 2.0 | 0.0 | 0.0 | 2.0 |
| 1998 | 0.0 | 0.0 | 0.0 | 0.0 | 0.0 | 0.0 | 1.0 | 0.0 | 0.0 | 2.0 | 1.0 |
| 1997 | 0.0 | 0.0 | 0.0 | 0.0 | 0.0 | 0.0 | 1.0 | 0.0 | 0.0 | 0.0 | 0.0 |
| 1996 | 0.0 | 0.0 | 0.0 | 0.0 | 2.0 | 0.0 | 4.0 | 0.0 | 0.0 | 0.0 | 1.0 |
| 1995 | 0.0 | 0.0 | 1.0 | 0.0 | 1.0 | 0.0 | 3.0 | 0.0 | 0.0 | 0.0 | 1.0 |
| 1994 | 0.0 | 0.0 | 0.0 | 0.0 | 3.0 | 0.0 | 1.0 | 0.0 | 0.0 | 0.0 | 0.0 |
| 1993 | 0.0 | 0.0 | 0.0 | 0.0 | 1.0 | 0.0 | 2.0 | 0.0 | 0.0 | 0.0 | 0.0 |
| 1992 | 0.0 | 0.0 | 0.0 | 0.0 | 2.0 | 0.0 | 2.0 | 0.0 | 0.0 | 0.0 | 0.0 |
| 1991 | 0.0 | 0.0 | 0.0 | 0.0 | 2.0 | 0.0 | 1.0 | 0.0 | 0.0 | 0.0 | 1.0 |
| 1990 | 0.0 | 0.0 | 0.0 | 0.0 | 5.0 | 0.0 | 0.0 | 4.0 | 0.0 | 0.0 | 0.0 |
| 1989 | 0.0 | 0.0 | 0.0 | 0.0 | 24.0 | 0.0 | 0.0 | 18.0 | 1.0 | 2.0 | 0.0 |
| 1988 | 0.0 | 0.0 | 0.0 | 0.0 | 27.0 | 0.0 | 0.0 | 11.0 | 1.0 | 6.0 | 0.0 |
| 1987 | 0.0 | 1.0 | 0.0 | 0.0 | 27.0 | 0.0 | 0.0 | 19.0 | 2.0 | 4.0 | 0.0 |
| 1986 | 0.0 | 0.0 | 0.0 | 0.0 | 0.0 | 0.0 | 1.0 | 1.0 | 0.0 | 0.0 | 0.0 |
| 1985 | 0.0 | 0.0 | 0.0 | 0.0 | 0.0 | 0.0 | 0.0 | 0.0 | 0.0 | 0.0 | 0.0 |
| 1984 | 0.0 | 0.0 | 0.0 | 0.0 | 0.0 | 0.0 | 0.0 | 0.0 | 0.0 | 0.0 | 0.0 |
| 1983 | 0.0 | 0.0 | 0.0 | 0.0 | 0.0 | 0.0 | 0.0 | 0.0 | 0.0 | 0.0 | 0.0 |
| 1982 | 0.0 | 0.0 | 0.0 | 0.0 | 0.0 | 0.0 | 0.0 | 0.0 | 0.0 | 0.0 | 0.0 |
Distribution map
Distribution - 2017
This map shows the observed distribution of the Galah for 2017.
The red circles are the grid cells where Galah have been reported.
The transparency of the red circles indicate how many surveys sheets were submitted for that grid cell; the darker the red the more reliable the data. Of the 315 grid cells with reports, 83 had only one sheet; an example is grid number A9.
The size of the circle represents the reporting rate. The maximum reporting rate for Galah was 100.0% (eg grid number A9) and the minimum was 2.9% (eg grid number M17). 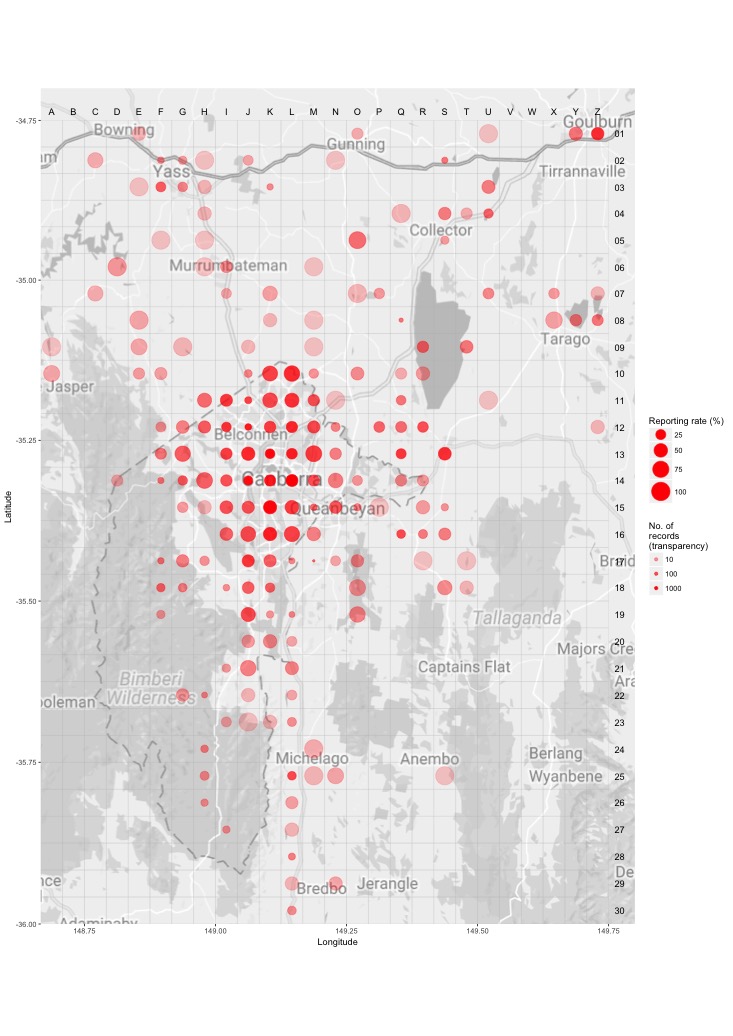
Distribution - all years
This map shows the observed distribution of the Galah for all years.
The red circles are the grid cells where Galah have been reported.
The transparency of the red circles indicate how many surveys sheets were submitted for that grid cell; the darker the red the more reliable the data. Of the 703 grid cells with reports, 55 had only one sheet; an example is grid number B13.
The size of the circle represents the reporting rate. The maximum reporting rate for Galah was 100.0% (eg grid number B13) and the minimum was 1.5% (eg grid number J26). 
Breeding map
Breeding - 2017
This map shows the breeding distribution of the Galah for 2017.
The red circles are the grid cells where breeding activity for Galah have been reported.
The size of the circle represents the number of reports. 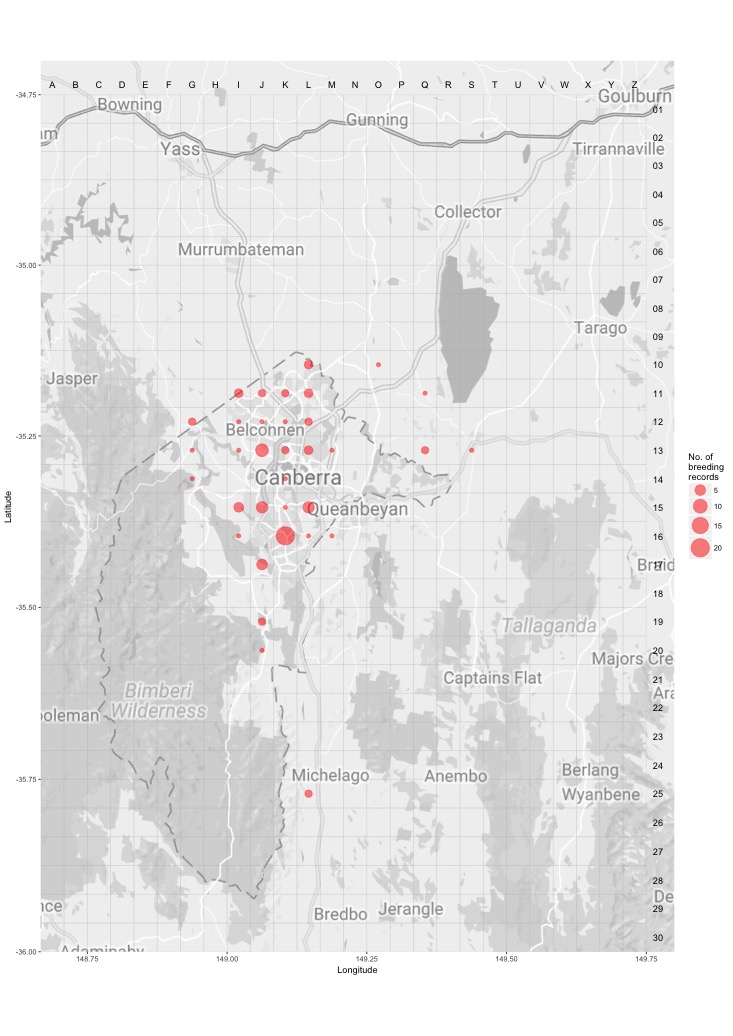
Breeding - all years
This map shows the breeding distribution of the Galah for all years.
The red circles are the grid cells where breeding activity for Galah have been reported.
The size of the circle represents the number of reports. 