Pied Currawong
Strepera graculina
ABR description
The following is extracted from the Annual Bird Report for the twelve months to June 2017.
Very common, breeding resident
5th most commonly reported species in the general records and 4th most commonly reported in the Garden Bird Survey.
General: Number of birds (16,490), similar to last year (17,017), and very many more reported than the 10YA (5,755) and the 30YA (2,700). Recorded in every week with a higher proportion of records in spring (29%) than in summer (22%), autumn (27%) and winter (22%). Reporting rate (36%) similar to last year (40%), the 10YA and the 30YA (both 37%). The reporting rate in 2014-15 (41.3) was the highest since 1990, and was the peak of a long-term steady rise since 1991. Recorded from 57% of grid cells, similar to last year (58%) the 10YA (59%) and 30YA (57%). Max 107 (227 last year) well below the 10YA and the 30YA (both 521), mean 3.3, median 2. 156 breeding records (102 last year), many more than the 10YA (47) and the 30YA (33), each month Aug to Feb plus nb in Jun, peaking in Oct/Nov.
GBS: Number of birds (8,422) fewer than last year (10,968), the 10YA (12,319) and the 30YA (10,684). Number of records (2,158) similar to last year (2,527), fewer than the 10YA (2,804) and similar to the 30YA (2,311). Recorded in all weeks, similar proportions of records in winter, spring and summer (24-25%) and 26% in autumn. Records from all sites. Abundance similar to last year, the 10YA (3.8481) and the 30YA (3.9267). The abundance has been remarkably steady around A=4.0000 since 1996. Max just 55 (127 last year), mean 3.9, median 2. 162 breeding records (192 last year) from 42% of sites, in each month Aug to Apr with 60% in Nov-Jan.

Abundance
Abundance is the average number of birds of that species per survey. Where the species was observed (presence recorded) but the number of birds seen was not recorded, this is treated as a count of zero.
Abundance by year
This chart shows the abundance of Pied Currawong between 1982 and 2017. 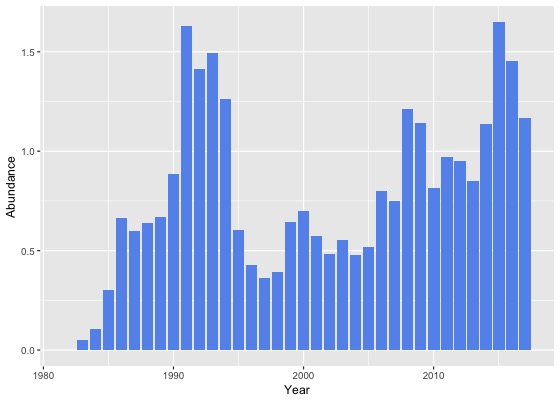
Abundance by month
This chart shows the monthly abundance of Pied Currawong. The blue lines show the abundance for the twelve months to June 2017 and the bars show the average abundance for the period 1982 to 2017. 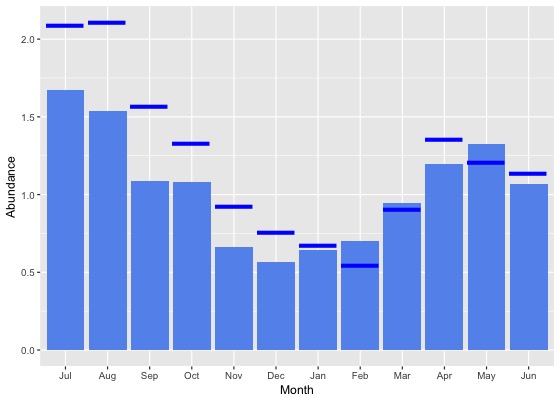
Abundance by season
This chart shows the seasonal abundance of Pied Currawong. The blue lines show the seasonal abundance for the twelve months to June 2017 and the bars show the average seasonal abundance for the period 1982 to 2017. 
Abundance data
| Month | Season | ||||||||||||||||||
|---|---|---|---|---|---|---|---|---|---|---|---|---|---|---|---|---|---|---|---|
| Period | Jul | Aug | Sep | Oct | Nov | Dec | Jan | Feb | Mar | Apr | May | Jun | Winter | Spring | Summer | Autumn | All | ||
| All years | |||||||||||||||||||
| All | 1.7 | 1.5 | 1.1 | 1.1 | 0.7 | 0.6 | 0.6 | 0.7 | 0.9 | 1.2 | 1.3 | 1.1 | 1.4 | 1.0 | 0.6 | 1.1 | 1.0 | ||
| Previous years | |||||||||||||||||||
| All previous years | 1.6 | 1.4 | 1.0 | 1.0 | 0.6 | 0.5 | 0.6 | 0.7 | 1.0 | 1.2 | 1.4 | 1.1 | 1.3 | 0.9 | 0.6 | 1.1 | 1.0 | ||
| Previous 30 years | 1.6 | 1.5 | 1.0 | 1.1 | 0.6 | 0.5 | 0.6 | 0.7 | 1.0 | 1.2 | 1.4 | 1.1 | 1.3 | 0.9 | 0.6 | 1.1 | 1.0 | ||
| Previous 20 years | 1.8 | 1.5 | 1.1 | 1.1 | 0.6 | 0.5 | 0.6 | 0.8 | 1.0 | 1.2 | 1.4 | 1.1 | 1.4 | 1.0 | 0.6 | 1.2 | 1.0 | ||
| 10 year groups | |||||||||||||||||||
| [2007,2017) | 2.5 | 1.9 | 1.2 | 1.3 | 0.8 | 0.6 | 0.7 | 0.9 | 1.2 | 1.4 | 1.8 | 1.3 | 1.8 | 1.1 | 0.7 | 1.4 | 1.2 | ||
| [1997,2007) | 0.6 | 0.9 | 0.7 | 0.6 | 0.4 | 0.4 | 0.5 | 0.5 | 0.6 | 0.7 | 0.6 | 0.6 | 0.7 | 0.6 | 0.4 | 0.6 | 0.6 | ||
| [1987,1997) | 1.0 | 1.2 | 0.9 | 0.7 | 0.6 | 0.6 | 0.6 | 0.6 | 0.7 | 1.0 | 1.2 | 1.0 | 1.1 | 0.7 | 0.6 | 1.0 | 0.8 | ||
| 5 year groups | |||||||||||||||||||
| [2012,2017) | 2.3 | 2.1 | 1.4 | 1.2 | 0.8 | 0.7 | 0.7 | 0.9 | 1.3 | 1.7 | 2.0 | 1.4 | 1.9 | 1.2 | 0.8 | 1.6 | 1.3 | ||
| [2007,2012) | 2.9 | 0.9 | 0.9 | 1.3 | 0.6 | 0.4 | 0.7 | 0.7 | 0.8 | 0.7 | 1.1 | 1.1 | 1.5 | 1.0 | 0.6 | 0.9 | 1.0 | ||
| [2002,2007) | 0.7 | 0.8 | 0.6 | 0.7 | 0.4 | 0.4 | 0.4 | 0.5 | 0.6 | 0.7 | 0.6 | 0.6 | 0.7 | 0.6 | 0.4 | 0.6 | 0.6 | ||
| [1997,2002) | 0.5 | 1.0 | 0.7 | 0.5 | 0.4 | 0.4 | 0.5 | 0.4 | 0.5 | 0.8 | 0.6 | 0.7 | 0.7 | 0.5 | 0.4 | 0.6 | 0.6 | ||
| [1992,1997) | 1.4 | 1.1 | 1.2 | 0.8 | 0.6 | 0.5 | 0.7 | 0.7 | 0.8 | 1.2 | 1.5 | 1.3 | 1.3 | 0.8 | 0.6 | 1.1 | 1.0 | ||
| [1987,1992) | 0.8 | 1.2 | 0.8 | 0.6 | 0.6 | 0.6 | 0.6 | 0.5 | 0.7 | 0.9 | 1.0 | 0.9 | 1.0 | 0.7 | 0.6 | 0.9 | 0.8 | ||
| Year | |||||||||||||||||||
| 2017 | 2.1 | 2.1 | 1.6 | 1.3 | 0.9 | 0.8 | 0.7 | 0.5 | 0.9 | 1.4 | 1.2 | 1.1 | 1.7 | 1.3 | 0.7 | 1.1 | 1.2 | ||
| 2016 | 2.0 | 2.2 | 1.8 | 1.4 | 1.2 | 1.0 | 0.9 | 0.9 | 1.7 | 1.7 | 1.7 | 1.2 | 1.8 | 1.5 | 0.9 | 1.7 | 1.5 | ||
| 2015 | 2.1 | 3.2 | 2.1 | 1.3 | 0.9 | 0.9 | 0.9 | 1.4 | 1.2 | 2.1 | 2.9 | 2.1 | 2.4 | 1.4 | 1.0 | 2.0 | 1.6 | ||
| 2014 | 2.0 | 1.1 | 0.8 | 1.5 | 0.7 | 0.6 | 0.6 | 1.0 | 1.1 | 1.9 | 1.5 | 1.2 | 1.3 | 1.1 | 0.7 | 1.5 | 1.1 | ||
| 2013 | 2.4 | 2.0 | 0.6 | 0.9 | 0.4 | 0.4 | 0.4 | 0.4 | 0.9 | 0.8 | 2.4 | 0.6 | 1.6 | 0.7 | 0.4 | 1.2 | 0.8 | ||
| 2012 | 3.7 | 0.8 | 0.6 | 0.8 | 0.4 | 0.4 | 0.5 | 0.5 | 1.2 | 1.7 | 0.8 | 1.2 | 1.8 | 0.6 | 0.5 | 1.3 | 1.0 | ||
| 2011 | 2.0 | 1.4 | 1.4 | 1.2 | 0.6 | 0.3 | 0.4 | 0.5 | 0.6 | 0.6 | 1.6 | 1.5 | 1.6 | 1.2 | 0.4 | 0.9 | 1.0 | ||
| 2010 | 0.9 | 0.9 | 0.7 | 1.2 | 0.5 | 0.6 | 0.5 | 0.7 | 1.0 | 0.6 | 1.4 | 0.7 | 0.8 | 0.9 | 0.6 | 0.9 | 0.8 | ||
| 2009 | 6.7 | 1.1 | 0.8 | 1.3 | 0.7 | 0.4 | 0.8 | 0.7 | 1.1 | 0.5 | 0.5 | 0.3 | 2.4 | 1.1 | 0.6 | 0.7 | 1.1 | ||
| 2008 | 1.0 | 0.7 | 1.0 | 1.4 | 0.7 | 0.6 | 1.4 | 1.0 | 0.8 | 1.1 | 1.0 | 2.9 | 1.8 | 1.2 | 0.9 | 1.0 | 1.2 | ||
| 2007 | 3.7 | 0.4 | 0.5 | 1.1 | 0.6 | 0.3 | 0.6 | 1.1 | 0.8 | 0.6 | 0.6 | 0.2 | 0.9 | 0.8 | 0.6 | 0.7 | 0.7 | ||
| 2006 | 1.6 | 0.5 | 0.7 | 1.5 | 0.5 | 0.3 | 0.5 | 0.5 | 0.6 | 1.1 | 0.4 | 0.6 | 0.9 | 1.1 | 0.4 | 0.7 | 0.8 | ||
| 2005 | 0.3 | 0.6 | 0.5 | 0.3 | 0.4 | 0.5 | 0.4 | 0.4 | 0.4 | 0.6 | 0.7 | 0.9 | 0.7 | 0.4 | 0.4 | 0.6 | 0.5 | ||
| 2004 | 0.4 | 0.7 | 0.7 | 0.4 | 0.3 | 0.4 | 0.5 | 0.3 | 0.7 | 0.5 | 0.6 | 0.2 | 0.4 | 0.5 | 0.4 | 0.6 | 0.5 | ||
| 2003 | 0.8 | 1.0 | 0.7 | 0.3 | 0.2 | 0.4 | 0.3 | 0.8 | 0.7 | 0.8 | 0.2 | 0.5 | 0.7 | 0.4 | 0.5 | 0.6 | 0.6 | ||
| 2002 | 0.6 | 1.0 | 0.6 | 0.3 | 0.5 | 0.4 | 0.3 | 0.3 | 0.4 | 0.5 | 0.8 | 0.5 | 0.7 | 0.4 | 0.4 | 0.5 | 0.5 | ||
| 2001 | 0.5 | 1.1 | 0.7 | 0.6 | 0.3 | 0.5 | 0.5 | 0.3 | 0.5 | 1.1 | 0.5 | 0.4 | 0.6 | 0.6 | 0.4 | 0.7 | 0.6 | ||
| 2000 | 0.9 | 1.1 | 1.1 | 0.5 | 0.5 | 0.3 | 0.4 | 0.5 | 0.6 | 0.9 | 0.7 | 1.3 | 1.1 | 0.7 | 0.4 | 0.8 | 0.7 | ||
| 1999 | 0.4 | 1.2 | 0.5 | 0.6 | 0.5 | 0.6 | 0.5 | 0.6 | 0.7 | 0.5 | 0.7 | 1.0 | 1.0 | 0.5 | 0.6 | 0.6 | 0.6 | ||
| 1998 | 0.1 | 0.6 | 0.7 | 0.4 | 0.2 | 0.2 | 0.7 | 0.4 | 0.2 | 0.6 | 0.7 | 0.1 | 0.3 | 0.4 | 0.4 | 0.4 | 0.4 | ||
| 1997 | 0.3 | 0.3 | 0.3 | 0.5 | 0.2 | 0.2 | 0.7 | 0.5 | 1.0 | 0.4 | 0.3 | 0.1 | 0.3 | 0.3 | 0.4 | 0.5 | 0.4 | ||
| 1996 | 0.4 | 0.5 | 0.1 | 0.4 | 0.4 | 0.6 | 0.7 | 0.3 | 0.2 | 1.0 | 0.3 | 0.4 | 0.4 | 0.3 | 0.5 | 0.5 | 0.4 | ||
| 1995 | 1.9 | 0.6 | 0.4 | 0.6 | 0.4 | 0.2 | 0.5 | 0.4 | 0.5 | 0.7 | 0.9 | 0.1 | 0.9 | 0.5 | 0.4 | 0.7 | 0.6 | ||
| 1994 | 1.0 | 2.2 | 1.2 | 1.5 | 0.8 | 0.5 | 0.7 | 0.8 | 0.5 | 1.4 | 0.9 | 3.1 | 2.3 | 1.1 | 0.7 | 1.0 | 1.3 | ||
| 1993 | 1.9 | 1.8 | 4.0 | 0.8 | 0.9 | 0.4 | 1.6 | 0.9 | 1.5 | 0.9 | 1.3 | 1.5 | 1.8 | 1.8 | 1.0 | 1.3 | 1.5 | ||
| 1992 | 1.8 | 0.4 | 1.1 | 0.9 | 0.6 | 0.9 | 0.2 | 1.5 | 1.3 | 2.1 | 4.1 | 1.8 | 1.4 | 0.9 | 0.8 | 2.6 | 1.4 | ||
| 1991 | 2.0 | 5.2 | 1.7 | 0.5 | 0.8 | 0.5 | 1.3 | 0.8 | 1.1 | 1.9 | 1.4 | 1.4 | 3.0 | 1.0 | 0.8 | 1.5 | 1.6 | ||
| 1990 | 0.5 | 0.5 | 0.4 | 0.3 | 0.4 | 0.4 | 0.4 | 0.4 | 0.5 | 1.5 | 4.1 | 2.6 | 0.9 | 0.4 | 0.4 | 1.9 | 0.9 | ||
| 1989 | 0.7 | 0.9 | 0.7 | 0.7 | 0.6 | 0.6 | 0.6 | 0.6 | 0.7 | 0.7 | 0.6 | 0.7 | 0.8 | 0.7 | 0.6 | 0.7 | 0.7 | ||
| 1988 | 0.5 | 0.7 | 0.7 | 0.7 | 0.6 | 0.6 | 0.5 | 0.6 | 0.7 | 0.8 | 0.6 | 0.6 | 0.6 | 0.7 | 0.6 | 0.7 | 0.6 | ||
| 1987 | 0.4 | 0.4 | 0.7 | 0.7 | 0.6 | 0.6 | 0.6 | 0.5 | 0.6 | 0.6 | 0.6 | 0.5 | 0.5 | 0.6 | 0.6 | 0.6 | 0.6 | ||
| 1986 | 0.3 | 0.6 | 0.5 | 0.9 | 0.5 | 0.5 | 0.6 | 0.2 | 0.6 | 1.8 | 0.4 | 0.5 | 0.5 | 0.6 | 0.4 | 1.1 | 0.7 | ||
| 1985 | 0.6 | 0.4 | 0.2 | 0.2 | 0.2 | 0.2 | 0.1 | 0.3 | 0.1 | 0.7 | 0.3 | 0.4 | 0.5 | 0.2 | 0.2 | 0.5 | 0.3 | ||
| 1984 | 0.0 | 0.0 | 0.0 | 0.0 | 0.0 | 0.0 | 0.1 | 0.0 | 0.3 | 0.1 | 0.3 | 0.0 | 0.0 | 0.0 | 0.1 | 0.2 | 0.1 | ||
| 1983 | 0.0 | 0.0 | 0.0 | 0.1 | 0.2 | 0.2 | 0.0 | 0.0 | 0.0 | - | 0.0 | 0.0 | 0.0 | 0.1 | 0.1 | 0.0 | 0.0 | ||
| 1982 | - | 0.0 | - | 0.0 | 0.0 | 0.0 | - | 0.0 | - | 0.0 | - | 0.0 | 0.0 | 0.0 | 0.0 | 0.0 | 0.0 | ||
Reporting rates
Reporting rate is the proportion of all surveys in which the species was present.
Reporting rate by year
This chart shows the reporting rate of Pied Currawong each year between 1982 and 2017. 
Reporting rate by month
This chart shows the reporting rate by month of Pied Currawong. The blue lines show the reporting rate for the twelve months to June 2017 and the bars show the average reporting rate for the period 1982 to 2017. 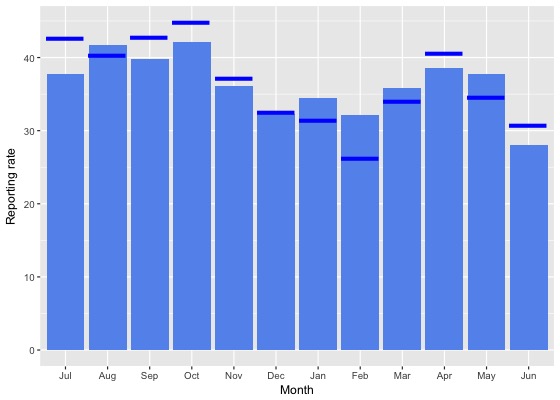
Reporting rate by season
This chart shows the seasonal reporting rate of Pied Currawong. The blue lines show the seasonal reporting rate for the twelve months to June 2017 and the bars show the average seasonal reporting rate for the period 1982 to 2017. 
Reporting rate data
| Month | Season | ||||||||||||||||||
|---|---|---|---|---|---|---|---|---|---|---|---|---|---|---|---|---|---|---|---|
| Period | Jul | Aug | Sep | Oct | Nov | Dec | Jan | Feb | Mar | Apr | May | Jun | Winter | Spring | Summer | Autumn | All | ||
| All years | |||||||||||||||||||
| All | 37.7 | 41.8 | 39.8 | 42.2 | 36.0 | 32.2 | 34.4 | 32.2 | 35.9 | 38.5 | 37.8 | 28.0 | 34.9 | 39.8 | 33.0 | 37.3 | 36.5 | ||
| Previous years | |||||||||||||||||||
| All previous years | 36.9 | 42.1 | 39.4 | 41.8 | 35.9 | 32.2 | 35.0 | 33.5 | 36.2 | 38.2 | 38.6 | 27.5 | 34.6 | 39.5 | 33.6 | 37.5 | 36.5 | ||
| Previous 30 years | 37.1 | 42.4 | 39.5 | 42.1 | 36.1 | 32.4 | 35.1 | 33.9 | 36.3 | 38.2 | 38.7 | 27.7 | 34.8 | 39.7 | 33.8 | 37.6 | 36.7 | ||
| Previous 20 years | 35.0 | 41.2 | 37.4 | 41.4 | 33.3 | 30.5 | 33.9 | 32.4 | 34.4 | 36.8 | 37.1 | 25.9 | 32.8 | 38.1 | 32.2 | 35.9 | 35.0 | ||
| 10 year groups | |||||||||||||||||||
| [2007,2017) | 40.1 | 43.1 | 39.6 | 43.6 | 36.6 | 33.5 | 35.4 | 33.9 | 36.7 | 39.0 | 39.3 | 27.6 | 35.5 | 40.8 | 34.3 | 38.2 | 37.5 | ||
| [1997,2007) | 26.3 | 37.2 | 33.1 | 33.6 | 26.6 | 24.7 | 28.9 | 28.3 | 29.2 | 31.1 | 31.7 | 22.2 | 27.5 | 31.4 | 26.9 | 30.5 | 29.2 | ||
| [1987,1997) | 44.3 | 46.1 | 50.5 | 46.1 | 45.4 | 43.5 | 42.1 | 40.9 | 47.0 | 45.3 | 44.8 | 36.6 | 42.4 | 47.1 | 42.3 | 45.7 | 44.6 | ||
| 5 year groups | |||||||||||||||||||
| [2012,2017) | 42.9 | 46.8 | 42.9 | 43.5 | 39.1 | 36.8 | 35.9 | 34.5 | 38.9 | 42.3 | 42.1 | 31.6 | 39.6 | 42.2 | 35.8 | 40.9 | 39.6 | ||
| [2007,2012) | 32.2 | 29.9 | 32.0 | 43.8 | 29.7 | 26.4 | 33.4 | 31.2 | 30.7 | 31.3 | 31.1 | 20.5 | 25.3 | 37.9 | 29.9 | 31.1 | 32.1 | ||
| [2002,2007) | 26.4 | 36.2 | 33.5 | 33.4 | 25.4 | 23.5 | 26.6 | 28.9 | 27.4 | 30.2 | 29.3 | 19.7 | 26.1 | 31.2 | 25.8 | 28.8 | 28.2 | ||
| [1997,2002) | 26.1 | 38.3 | 32.6 | 34.0 | 28.0 | 26.2 | 31.5 | 27.7 | 31.7 | 32.2 | 34.7 | 25.6 | 29.5 | 31.6 | 28.3 | 32.6 | 30.6 | ||
| [1992,1997) | 25.5 | 23.4 | 22.9 | 22.7 | 24.6 | 17.3 | 21.5 | 20.1 | 23.2 | 23.5 | 25.5 | 16.3 | 21.5 | 23.4 | 19.7 | 24.0 | 22.3 | ||
| [1987,1992) | 52.7 | 58.4 | 63.5 | 58.9 | 55.4 | 55.0 | 53.5 | 48.9 | 61.2 | 57.7 | 54.7 | 48.1 | 53.3 | 59.0 | 52.5 | 57.9 | 55.9 | ||
| Year | |||||||||||||||||||
| 2017 | 42.7 | 40.3 | 42.8 | 44.8 | 37.2 | 32.5 | 31.4 | 26.2 | 34.0 | 40.5 | 34.5 | 30.7 | 36.7 | 41.9 | 30.0 | 36.2 | 36.2 | ||
| 2016 | 45.0 | 44.1 | 43.4 | 42.9 | 44.8 | 36.7 | 35.1 | 31.7 | 42.5 | 43.1 | 38.5 | 31.4 | 40.1 | 43.5 | 34.4 | 41.7 | 39.9 | ||
| 2015 | 42.0 | 56.6 | 51.7 | 43.3 | 34.7 | 36.7 | 34.6 | 38.0 | 37.2 | 43.1 | 50.0 | 36.5 | 43.5 | 43.5 | 36.3 | 42.8 | 41.3 | ||
| 2014 | 42.4 | 46.6 | 34.0 | 49.1 | 39.6 | 36.7 | 38.4 | 32.9 | 37.8 | 43.2 | 41.5 | 31.3 | 38.3 | 42.6 | 36.4 | 40.5 | 39.5 | ||
| 2013 | 36.4 | 36.2 | 41.8 | 41.4 | 33.8 | 37.5 | 38.5 | 39.3 | 39.0 | 45.8 | 41.0 | 24.9 | 31.9 | 39.5 | 38.3 | 41.9 | 38.6 | ||
| 2012 | 45.1 | 47.2 | 35.9 | 42.0 | 39.9 | 36.4 | 34.1 | 33.7 | 31.2 | 33.1 | 37.4 | 26.8 | 38.5 | 39.9 | 34.8 | 33.3 | 37.0 | ||
| 2011 | 43.1 | 31.2 | 32.6 | 45.9 | 30.9 | 37.2 | 44.4 | 35.2 | 35.6 | 39.8 | 31.3 | 27.6 | 31.6 | 39.4 | 39.4 | 35.8 | 37.0 | ||
| 2010 | 34.4 | 28.1 | 33.0 | 44.4 | 25.8 | 25.8 | 30.4 | 28.2 | 29.1 | 28.1 | 37.3 | 26.3 | 28.4 | 37.1 | 27.9 | 30.1 | 31.9 | ||
| 2009 | 35.3 | 39.6 | 29.3 | 38.1 | 29.5 | 23.3 | 28.7 | 24.2 | 27.4 | 21.7 | 22.1 | 14.4 | 26.0 | 34.0 | 25.3 | 23.9 | 28.6 | ||
| 2008 | 26.2 | 33.0 | 36.3 | 49.1 | 35.6 | 25.7 | 42.1 | 30.6 | 33.3 | 34.8 | 36.0 | 20.1 | 25.1 | 43.7 | 31.4 | 34.6 | 35.8 | ||
| 2007 | 19.8 | 18.5 | 28.6 | 40.7 | 28.4 | 17.1 | 19.7 | 33.9 | 26.8 | 28.2 | 30.9 | 12.1 | 14.8 | 35.0 | 21.0 | 28.2 | 25.9 | ||
| 2006 | 27.0 | 33.0 | 30.8 | 45.8 | 28.6 | 16.8 | 24.2 | 23.0 | 25.2 | 32.3 | 25.4 | 17.2 | 23.3 | 37.8 | 21.1 | 27.2 | 28.5 | ||
| 2005 | 20.6 | 24.3 | 26.8 | 19.3 | 22.1 | 22.3 | 32.6 | 25.0 | 25.1 | 33.9 | 33.8 | 21.0 | 21.6 | 23.4 | 25.8 | 30.6 | 25.5 | ||
| 2004 | 27.4 | 42.1 | 35.1 | 31.4 | 25.0 | 19.4 | 23.0 | 16.2 | 21.2 | 24.7 | 22.3 | 11.0 | 26.6 | 30.8 | 20.0 | 22.8 | 25.3 | ||
| 2003 | 33.3 | 40.3 | 39.0 | 28.5 | 20.6 | 23.7 | 23.7 | 44.5 | 32.7 | 31.8 | 26.4 | 24.2 | 32.1 | 29.7 | 30.6 | 30.9 | 30.7 | ||
| 2002 | 24.6 | 37.3 | 37.3 | 29.2 | 30.5 | 30.4 | 30.2 | 26.3 | 33.2 | 28.0 | 37.6 | 25.3 | 28.0 | 32.2 | 29.4 | 32.1 | 30.5 | ||
| 2001 | 28.9 | 47.0 | 38.9 | 42.0 | 34.1 | 35.5 | 28.0 | 26.8 | 29.2 | 41.0 | 32.9 | 25.6 | 32.8 | 38.7 | 30.7 | 33.5 | 34.1 | ||
| 2000 | 34.1 | 45.1 | 41.4 | 37.4 | 34.3 | 24.4 | 33.1 | 30.5 | 40.8 | 33.2 | 32.7 | 34.4 | 37.8 | 37.7 | 28.9 | 36.3 | 34.7 | ||
| 1999 | 29.4 | 28.9 | 27.6 | 30.2 | 33.1 | 32.5 | 35.8 | 35.0 | 35.1 | 29.4 | 41.5 | 29.9 | 29.6 | 30.2 | 34.3 | 35.1 | 32.6 | ||
| 1998 | 16.2 | 34.0 | 24.4 | 20.7 | 13.3 | 11.3 | 30.9 | 13.2 | 11.8 | 28.2 | 25.9 | 9.3 | 18.8 | 19.5 | 17.6 | 18.2 | 18.7 | ||
| 1997 | 10.3 | 15.5 | 13.6 | 22.4 | 14.5 | 12.5 | 27.5 | 15.8 | 27.5 | 20.2 | 24.4 | 6.9 | 10.6 | 16.2 | 17.0 | 22.7 | 16.4 | ||
| 1996 | 20.9 | 14.9 | 9.3 | 17.5 | 23.1 | 17.2 | 18.4 | 15.3 | 14.7 | 20.3 | 13.8 | 13.8 | 16.1 | 17.5 | 17.1 | 16.1 | 16.8 | ||
| 1995 | 24.7 | 17.8 | 15.5 | 15.9 | 17.3 | 9.2 | 22.1 | 17.5 | 17.3 | 21.8 | 18.2 | 10.6 | 17.7 | 16.2 | 16.7 | 19.4 | 17.5 | ||
| 1994 | 25.5 | 36.4 | 30.9 | 33.7 | 22.1 | 21.7 | 22.1 | 19.0 | 20.5 | 19.1 | 21.2 | 15.7 | 25.3 | 27.6 | 20.9 | 20.1 | 23.6 | ||
| 1993 | 24.5 | 34.6 | 37.1 | 21.3 | 34.8 | 23.9 | 34.7 | 18.8 | 37.0 | 21.7 | 29.9 | 30.4 | 30.6 | 30.5 | 26.8 | 30.3 | 29.8 | ||
| 1992 | 32.3 | 16.7 | 27.1 | 31.9 | 33.3 | 20.6 | 13.8 | 36.6 | 31.0 | 42.4 | 42.1 | 13.3 | 21.2 | 30.7 | 22.2 | 38.3 | 28.8 | ||
| 1991 | 22.8 | 23.4 | 26.7 | 19.4 | 25.8 | 17.6 | 21.4 | 24.0 | 33.3 | 39.0 | 23.0 | 18.0 | 22.1 | 23.8 | 20.6 | 31.7 | 24.2 | ||
| 1990 | 52.9 | 52.4 | 45.2 | 29.6 | 39.3 | 45.8 | 40.3 | 28.2 | 26.1 | 29.8 | 38.4 | 39.5 | 50.2 | 37.9 | 38.1 | 31.0 | 40.9 | ||
| 1989 | 68.4 | 66.4 | 73.8 | 69.6 | 59.6 | 59.1 | 60.1 | 53.1 | 68.9 | 57.9 | 57.2 | 51.8 | 62.9 | 68.1 | 57.5 | 61.5 | 62.7 | ||
| 1988 | 55.6 | 68.3 | 72.5 | 69.1 | 58.1 | 62.1 | 55.3 | 57.1 | 75.7 | 67.4 | 64.6 | 56.5 | 60.7 | 65.6 | 58.2 | 69.3 | 63.5 | ||
| 1987 | 54.5 | 53.3 | 67.2 | 64.8 | 64.2 | 60.2 | 59.5 | 50.8 | 63.6 | 64.2 | 58.1 | 47.1 | 47.8 | 65.3 | 56.5 | 62.0 | 60.3 | ||
| 1986 | 38.5 | 42.1 | 43.4 | 52.8 | 44.7 | 44.1 | 43.5 | 25.0 | 48.4 | 68.6 | 44.8 | 37.1 | 39.4 | 46.3 | 36.6 | 56.8 | 45.3 | ||
| 1985 | 20.0 | 26.7 | 19.2 | 15.1 | 14.0 | 10.0 | 12.5 | 17.6 | 9.1 | 42.1 | 40.0 | 35.7 | 27.3 | 15.9 | 11.8 | 32.5 | 19.1 | ||
| 1984 | 0.0 | 0.0 | 0.0 | 0.0 | 0.0 | 0.0 | 13.8 | 3.0 | 25.9 | 8.8 | 29.0 | 2.9 | 2.0 | 0.0 | 6.8 | 20.7 | 10.6 | ||
| 1983 | 0.0 | 0.0 | 0.0 | 7.7 | 22.2 | 15.4 | 0.0 | 0.0 | 0.0 | - | 0.0 | 0.0 | 0.0 | 11.1 | 6.7 | 0.0 | 5.0 | ||
| 1982 | - | 0.0 | - | 0.0 | 0.0 | 0.0 | - | 0.0 | - | 0.0 | - | 0.0 | 0.0 | 0.0 | 0.0 | 0.0 | 0.0 | ||
Breeding data
Breeding records by month
Number of breeding records by breeding code and month, 2017 and all years| Breeding code | Jul | Aug | Sep | Oct | Nov | Dec | Jan | Feb | Mar | Apr | May | Jun |
|---|---|---|---|---|---|---|---|---|---|---|---|---|
| 2017 | ||||||||||||
| Breeding (BLA code) | 0 | 0 | 0 | 0 | 0 | 1 | 0 | 1 | 0 | 0 | 0 | 0 |
| Carrying Food | 0 | 0 | 0 | 4 | 0 | 0 | 1 | 0 | 0 | 0 | 0 | 0 |
| Copulating | 0 | 0 | 0 | 0 | 0 | 0 | 0 | 0 | 0 | 0 | 0 | 0 |
| Display | 0 | 0 | 0 | 0 | 0 | 0 | 0 | 0 | 0 | 0 | 0 | 0 |
| Dependent young | 0 | 1 | 0 | 1 | 2 | 20 | 10 | 7 | 0 | 0 | 0 | 0 |
| Faecal sac | 0 | 0 | 0 | 0 | 0 | 0 | 0 | 0 | 0 | 0 | 0 | 0 |
| Inspecting hollow | 0 | 0 | 0 | 0 | 0 | 0 | 0 | 0 | 0 | 0 | 0 | 0 |
| Nest building | 0 | 2 | 7 | 2 | 0 | 0 | 0 | 0 | 0 | 0 | 0 | 1 |
| Nest with eggs | 0 | 0 | 0 | 0 | 0 | 0 | 0 | 0 | 0 | 0 | 0 | 0 |
| Nest with young | 0 | 0 | 0 | 17 | 25 | 2 | 2 | 0 | 0 | 0 | 0 | 0 |
| On/leaving nest | 0 | 0 | 3 | 38 | 7 | 2 | 0 | 0 | 0 | 0 | 0 | 0 |
| All years | ||||||||||||
| Breeding (BLA code) | 0 | 0 | 2 | 10 | 22 | 12 | 6 | 1 | 0 | 0 | 0 | 0 |
| Carrying Food | 1 | 0 | 1 | 25 | 9 | 5 | 3 | 0 | 1 | 0 | 0 | 0 |
| Copulating | 2 | 0 | 0 | 0 | 0 | 0 | 0 | 0 | 0 | 0 | 0 | 0 |
| Display | 0 | 0 | 1 | 0 | 0 | 0 | 0 | 0 | 0 | 0 | 0 | 0 |
| Dependent young | 0 | 2 | 3 | 28 | 80 | 194 | 124 | 23 | 2 | 0 | 1 | 0 |
| Faecal sac | 0 | 0 | 0 | 0 | 0 | 0 | 0 | 0 | 0 | 0 | 0 | 0 |
| Inspecting hollow | 0 | 0 | 0 | 0 | 0 | 0 | 0 | 0 | 0 | 0 | 0 | 0 |
| Nest building | 0 | 19 | 33 | 28 | 10 | 3 | 3 | 0 | 1 | 3 | 0 | 2 |
| Nest with eggs | 0 | 1 | 15 | 24 | 9 | 1 | 0 | 0 | 0 | 0 | 0 | 0 |
| Nest with young | 0 | 0 | 11 | 100 | 79 | 14 | 6 | 1 | 0 | 0 | 0 | 0 |
| On/leaving nest | 0 | 1 | 32 | 167 | 26 | 4 | 1 | 0 | 0 | 1 | 0 | 0 |
Breeding records by year
Average number of breeding records per period by breeding code| Period | Breeding (BLA code) | Carrying Food | Copulating | Display | Dependent young | Faecal sac | Inspecting hollow | Nest building | Nest with eggs | Nest with young | On/leaving nest |
|---|---|---|---|---|---|---|---|---|---|---|---|
| All years | |||||||||||
| All | 1.5 | 1.2 | 0.1 | 0.0 | 12.7 | 0.0 | 0.0 | 2.8 | 1.4 | 5.9 | 6.4 |
| Previous years | |||||||||||
| All previous years | 1.5 | 1.1 | 0.1 | 0.0 | 11.9 | 0.0 | 0.0 | 2.6 | 1.4 | 4.7 | 5.2 |
| Previous 30 years | 1.7 | 1.3 | 0.1 | 0.0 | 13.8 | 0.0 | 0.0 | 2.8 | 1.7 | 5.5 | 6.0 |
| Previous 20 years | 2.5 | 1.2 | 0.1 | 0.0 | 12.9 | 0.0 | 0.0 | 2.0 | 0.4 | 5.5 | 8.1 |
| 10 year groups | |||||||||||
| [2007,2017) | 1.7 | 2.0 | 0.2 | 0.0 | 17.0 | 0.0 | 0.0 | 3.4 | 0.5 | 8.8 | 13.0 |
| [1997,2007) | 3.4 | 0.5 | 0.0 | 0.1 | 8.9 | 0.0 | 0.0 | 0.6 | 0.3 | 2.3 | 3.1 |
| [1987,1997) | 0.0 | 1.5 | 0.0 | 0.0 | 15.6 | 0.0 | 0.0 | 4.5 | 4.2 | 5.3 | 1.9 |
| 5 year groups | |||||||||||
| [2012,2017) | 1.6 | 2.2 | 0.0 | 0.0 | 21.2 | 0.0 | 0.0 | 5.0 | 1.0 | 11.0 | 13.2 |
| [2007,2012) | 1.8 | 1.8 | 0.4 | 0.0 | 12.8 | 0.0 | 0.0 | 1.8 | 0.0 | 6.6 | 12.8 |
| [2002,2007) | 1.8 | 0.8 | 0.0 | 0.2 | 10.2 | 0.0 | 0.0 | 0.8 | 0.0 | 2.8 | 4.0 |
| [1997,2002) | 5.0 | 0.2 | 0.0 | 0.0 | 7.6 | 0.0 | 0.0 | 0.4 | 0.6 | 1.8 | 2.2 |
| [1992,1997) | 0.0 | 0.0 | 0.0 | 0.0 | 3.2 | 0.0 | 0.0 | 0.8 | 0.0 | 1.2 | 3.4 |
| [1987,1992) | 0.0 | 3.0 | 0.0 | 0.0 | 28.0 | 0.0 | 0.0 | 8.2 | 8.4 | 9.4 | 0.4 |
| Year | |||||||||||
| 2017 | 2.0 | 5.0 | 0.0 | 0.0 | 41.0 | 0.0 | 0.0 | 12.0 | 0.0 | 46.0 | 50.0 |
| 2016 | 0.0 | 2.0 | 0.0 | 0.0 | 43.0 | 0.0 | 0.0 | 10.0 | 0.0 | 25.0 | 22.0 |
| 2015 | 0.0 | 3.0 | 0.0 | 0.0 | 23.0 | 0.0 | 0.0 | 4.0 | 5.0 | 13.0 | 21.0 |
| 2014 | 0.0 | 1.0 | 0.0 | 0.0 | 16.0 | 0.0 | 0.0 | 7.0 | 0.0 | 10.0 | 9.0 |
| 2013 | 3.0 | 1.0 | 0.0 | 0.0 | 15.0 | 0.0 | 0.0 | 3.0 | 0.0 | 4.0 | 6.0 |
| 2012 | 5.0 | 4.0 | 0.0 | 0.0 | 9.0 | 0.0 | 0.0 | 1.0 | 0.0 | 3.0 | 8.0 |
| 2011 | 2.0 | 1.0 | 0.0 | 0.0 | 21.0 | 0.0 | 0.0 | 2.0 | 0.0 | 6.0 | 6.0 |
| 2010 | 0.0 | 1.0 | 0.0 | 0.0 | 13.0 | 0.0 | 0.0 | 0.0 | 0.0 | 3.0 | 21.0 |
| 2009 | 5.0 | 3.0 | 0.0 | 0.0 | 12.0 | 0.0 | 0.0 | 1.0 | 0.0 | 6.0 | 8.0 |
| 2008 | 0.0 | 1.0 | 2.0 | 0.0 | 14.0 | 0.0 | 0.0 | 5.0 | 0.0 | 8.0 | 19.0 |
| 2007 | 2.0 | 3.0 | 0.0 | 0.0 | 4.0 | 0.0 | 0.0 | 1.0 | 0.0 | 10.0 | 10.0 |
| 2006 | 2.0 | 1.0 | 0.0 | 1.0 | 12.0 | 0.0 | 0.0 | 0.0 | 0.0 | 9.0 | 10.0 |
| 2005 | 0.0 | 2.0 | 0.0 | 0.0 | 14.0 | 0.0 | 0.0 | 1.0 | 0.0 | 0.0 | 1.0 |
| 2004 | 0.0 | 1.0 | 0.0 | 0.0 | 10.0 | 0.0 | 0.0 | 1.0 | 0.0 | 2.0 | 4.0 |
| 2003 | 1.0 | 0.0 | 0.0 | 0.0 | 7.0 | 0.0 | 0.0 | 2.0 | 0.0 | 3.0 | 1.0 |
| 2002 | 6.0 | 0.0 | 0.0 | 0.0 | 8.0 | 0.0 | 0.0 | 0.0 | 0.0 | 0.0 | 4.0 |
| 2001 | 7.0 | 1.0 | 0.0 | 0.0 | 14.0 | 0.0 | 0.0 | 1.0 | 0.0 | 3.0 | 2.0 |
| 2000 | 11.0 | 0.0 | 0.0 | 0.0 | 9.0 | 0.0 | 0.0 | 0.0 | 1.0 | 1.0 | 3.0 |
| 1999 | 7.0 | 0.0 | 0.0 | 0.0 | 12.0 | 0.0 | 0.0 | 1.0 | 0.0 | 2.0 | 3.0 |
| 1998 | 0.0 | 0.0 | 0.0 | 0.0 | 1.0 | 0.0 | 0.0 | 0.0 | 2.0 | 2.0 | 0.0 |
| 1997 | 0.0 | 0.0 | 0.0 | 0.0 | 2.0 | 0.0 | 0.0 | 0.0 | 0.0 | 1.0 | 3.0 |
| 1996 | 0.0 | 0.0 | 0.0 | 0.0 | 4.0 | 0.0 | 0.0 | 1.0 | 0.0 | 1.0 | 3.0 |
| 1995 | 0.0 | 0.0 | 0.0 | 0.0 | 2.0 | 0.0 | 0.0 | 0.0 | 0.0 | 2.0 | 5.0 |
| 1994 | 0.0 | 0.0 | 0.0 | 0.0 | 3.0 | 0.0 | 0.0 | 1.0 | 0.0 | 1.0 | 5.0 |
| 1993 | 0.0 | 0.0 | 0.0 | 0.0 | 6.0 | 0.0 | 0.0 | 0.0 | 0.0 | 0.0 | 1.0 |
| 1992 | 0.0 | 0.0 | 0.0 | 0.0 | 1.0 | 0.0 | 0.0 | 2.0 | 0.0 | 2.0 | 3.0 |
| 1991 | 0.0 | 1.0 | 0.0 | 0.0 | 6.0 | 0.0 | 0.0 | 0.0 | 0.0 | 1.0 | 2.0 |
| 1990 | 0.0 | 1.0 | 0.0 | 0.0 | 19.0 | 0.0 | 0.0 | 3.0 | 3.0 | 3.0 | 0.0 |
| 1989 | 0.0 | 7.0 | 0.0 | 0.0 | 36.0 | 0.0 | 0.0 | 13.0 | 11.0 | 12.0 | 0.0 |
| 1988 | 0.0 | 4.0 | 0.0 | 0.0 | 39.0 | 0.0 | 0.0 | 10.0 | 11.0 | 15.0 | 0.0 |
| 1987 | 0.0 | 2.0 | 0.0 | 0.0 | 40.0 | 0.0 | 0.0 | 15.0 | 17.0 | 16.0 | 0.0 |
| 1986 | 0.0 | 0.0 | 0.0 | 0.0 | 1.0 | 0.0 | 0.0 | 5.0 | 0.0 | 0.0 | 2.0 |
| 1985 | 0.0 | 0.0 | 0.0 | 0.0 | 0.0 | 0.0 | 0.0 | 0.0 | 0.0 | 1.0 | 0.0 |
| 1984 | 0.0 | 0.0 | 0.0 | 0.0 | 0.0 | 0.0 | 0.0 | 0.0 | 0.0 | 0.0 | 0.0 |
| 1983 | 0.0 | 0.0 | 0.0 | 0.0 | 0.0 | 0.0 | 0.0 | 0.0 | 0.0 | 0.0 | 0.0 |
| 1982 | 0.0 | 0.0 | 0.0 | 0.0 | 0.0 | 0.0 | 0.0 | 0.0 | 0.0 | 0.0 | 0.0 |
Distribution map
Distribution - 2017
This map shows the observed distribution of the Pied Currawong for 2017.
The red circles are the grid cells where Pied Currawong have been reported.
The transparency of the red circles indicate how many surveys sheets were submitted for that grid cell; the darker the red the more reliable the data. Of the 315 grid cells with reports, 83 had only one sheet; an example is grid number A11.
The size of the circle represents the reporting rate. The maximum reporting rate for Pied Currawong was 100.0% (eg grid number A11) and the minimum was 4.0% (eg grid number S13). 
Distribution - all years
This map shows the observed distribution of the Pied Currawong for all years.
The red circles are the grid cells where Pied Currawong have been reported.
The transparency of the red circles indicate how many surveys sheets were submitted for that grid cell; the darker the red the more reliable the data. Of the 703 grid cells with reports, 55 had only one sheet; an example is grid number A5.
The size of the circle represents the reporting rate. The maximum reporting rate for Pied Currawong was 100.0% (eg grid number A15) and the minimum was 0.3% (eg grid number Z8). 
Breeding map
Breeding - 2017
This map shows the breeding distribution of the Pied Currawong for 2017.
The red circles are the grid cells where breeding activity for Pied Currawong have been reported.
The size of the circle represents the number of reports. 
Breeding - all years
This map shows the breeding distribution of the Pied Currawong for all years.
The red circles are the grid cells where breeding activity for Pied Currawong have been reported.
The size of the circle represents the number of reports. 